

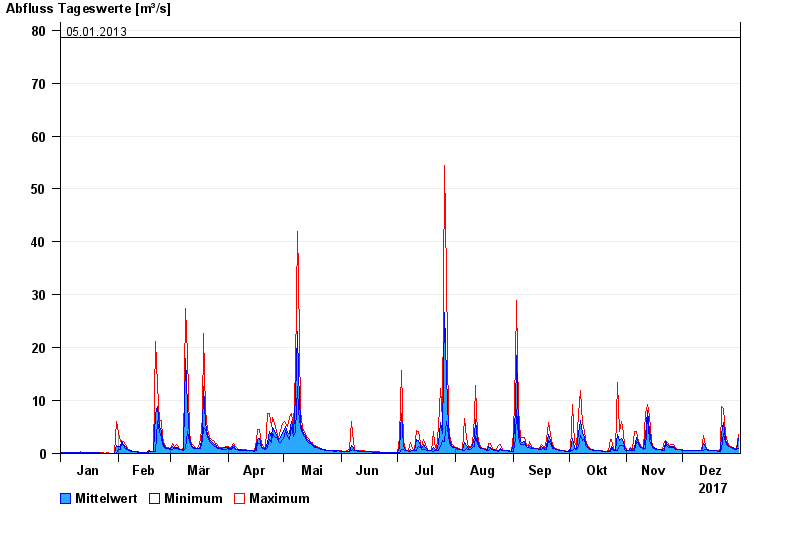
Chart of year Aschau / Prien
Discharge from 01.01.2017 to 31.12.2017
- 01.06.2013 Abfluss: 128 m³/s
- 12.08.2002 Abfluss: 110 m³/s
- 03.06.2010 Abfluss: 98,3 m³/s
- 04.08.2020 Abfluss: 80,3 m³/s
- 05.01.2013 Abfluss: 78,6 m³/s
| Date | Mean value [m³/s] | Maximum [m³/s] | Minimum [m³/s] |
|---|---|---|---|
| 31.12.2017 | 2.83 | 3.53 | 0.953 |
| 30.12.2017 | 0.762 | 0.953 | 0.749 |
| 29.12.2017 | 0.837 | 0.953 | 0.749 |
| 28.12.2017 | 1.07 | 1.18 | 0.953 |
| 27.12.2017 | 1.17 | 1.31 | 1.06 |
| 26.12.2017 | 1.41 | 1.58 | 1.31 |
| 25.12.2017 | 1.68 | 2.03 | 1.58 |
© Bayerisches Landesamt für Umwelt 2024