

Chart of total period Aschau / Prien
Discharge from 02.08.2001 to 27.04.2024
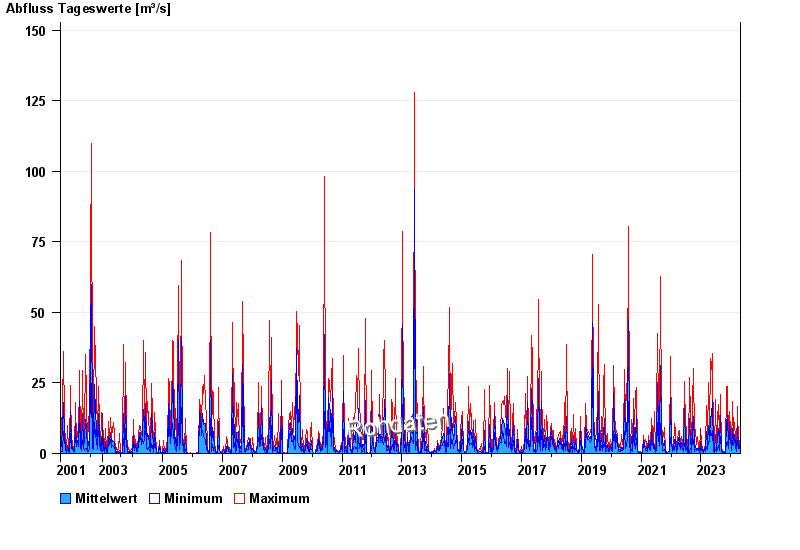
| Date | Mean value [m³/s] | Maximum [m³/s] | Minimum [m³/s] |
|---|---|---|---|
| 27.04.2024 | 3.29 | 3.34 | 3.11 |
| 26.04.2024 | 1.93 | 3.58 | 1.2 |
| 25.04.2024 | 1.19 | 1.46 | 1.08 |
| 24.04.2024 | 1.21 | 1.32 | 1.08 |
| 23.04.2024 | 1.42 | 1.61 | 1.32 |
| 22.04.2024 | 1.77 | 2.29 | 1.61 |
| 21.04.2024 | 2.03 | 2.29 | 1.76 |
© Bayerisches Landesamt für Umwelt 2024