

Chart of total period Anger / Attel
Discharge from 01.11.1950 to 26.04.2024
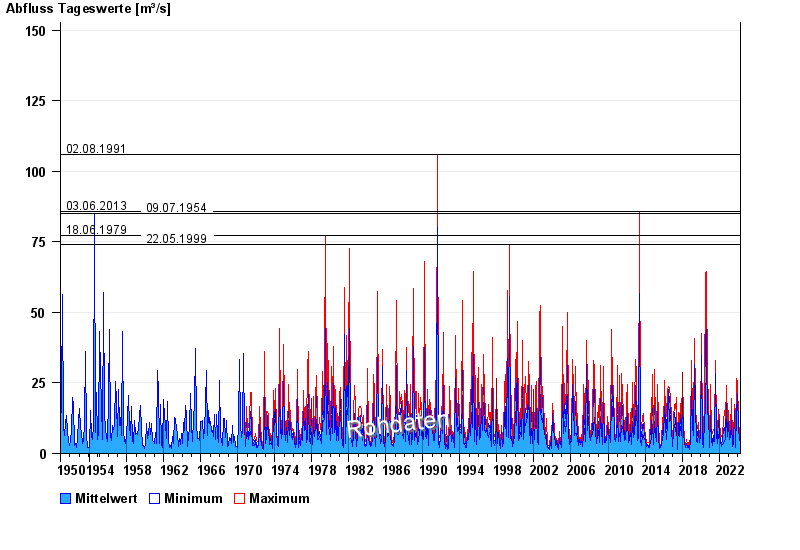
- 02.08.1991 Abfluss: 106 m³/s
- 03.06.2013 Abfluss: 85,9 m³/s
- 09.07.1954 Abfluss: 85 m³/s
- 18.06.1979 Abfluss: 77,1 m³/s
- 22.05.1999 Abfluss: 74,2 m³/s
| Date | Mean value [m³/s] | Maximum [m³/s] | Minimum [m³/s] |
|---|---|---|---|
| 26.04.2024 | 3.58 | 4.33 | 2.28 |
| 25.04.2024 | 4.05 | 4.6 | 3.29 |
| 24.04.2024 | 4.08 | 4.6 | 3.03 |
| 23.04.2024 | 3.84 | 4.33 | 3.29 |
| 22.04.2024 | 4.7 | 5.41 | 3.81 |
| 21.04.2024 | 5.02 | 5.97 | 4.06 |
| 20.04.2024 | 3.85 | 4.33 | 3.29 |
© Bayerisches Landesamt für Umwelt 2024