

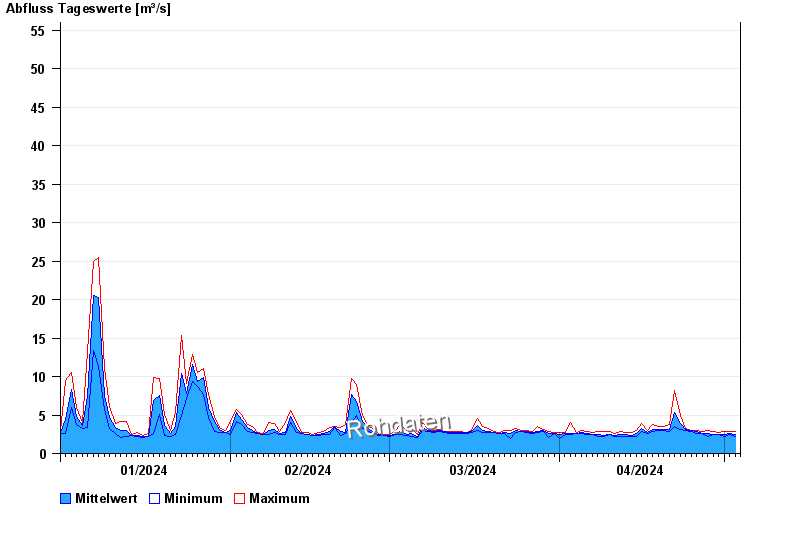
Chart of year Aham / Vils
Discharge from 01.01.2024 to 03.05.2024
- HQ1 62 m³/s
- HQ2 93 m³/s
- HQ5 130 m³/s
- HQ10 165 m³/s
- HQ20 195 m³/s
- HQ50 243 m³/s
- HQ100 280 m³/s
| Date | Mean value [m³/s] | Maximum [m³/s] | Minimum [m³/s] |
|---|---|---|---|
| 03.05.2024 | 2.63 | 2.72 | 2.26 |
| 02.05.2024 | 2.57 | 2.87 | 2.41 |
| 01.05.2024 | 2.47 | 2.87 | 2.26 |
| 30.04.2024 | 2.5 | 2.72 | 2.41 |
| 29.04.2024 | 2.49 | 2.87 | 2.41 |
| 28.04.2024 | 2.6 | 3.02 | 2.26 |
| 27.04.2024 | 2.59 | 2.87 | 2.57 |
© Bayerisches Landesamt für Umwelt 2024