
- Start >
- Rivers >
- Discharge >
- Iller - Lech - Bodensee >
- Wittislingen >
- Chart of year

Chart of year Wittislingen / Egau
Discharge from 29.03.2024 to 28.03.2025
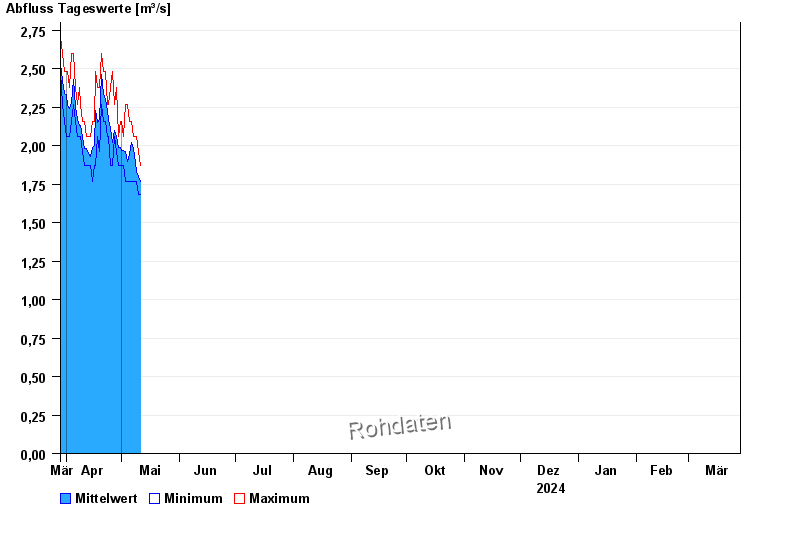
| Date | Mean value [m³/s] | Maximum [m³/s] | Minimum [m³/s] |
|---|---|---|---|
| 29.05.2024 | 2.16 | 2.3 | 2.08 |
| 28.05.2024 | 2.34 | 2.64 | 1.98 |
| 27.05.2024 | 2.07 | 2.3 | 1.77 |
| 26.05.2024 | 2.22 | 2.42 | 1.88 |
| 25.05.2024 | 2.41 | 3.12 | 2.19 |
| 24.05.2024 | 2.4 | 2.76 | 2.08 |
| 23.05.2024 | 2.26 | 2.64 | 1.88 |
© Bayerisches Landesamt für Umwelt 2024