
- Start >
- Rivers >
- Discharge >
- Iller - Lech - Bodensee >
- Wittislingen >
- Chart of year

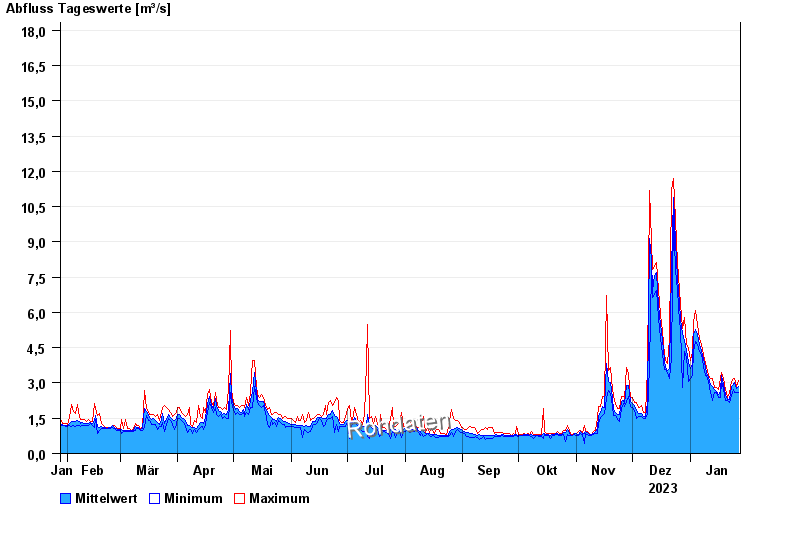
Chart of year Wittislingen / Egau
Discharge from 28.01.2023 to 27.01.2024
- 14.04.1994 Abfluss: 32,2 m³/s
- 03.03.1956 Abfluss: 27,8 m³/s
- 15.02.1990 Abfluss: 23,6 m³/s
- 06.01.1982 Abfluss: 23,3 m³/s
- 23.03.2002 Abfluss: 21,8 m³/s
| Date | Mean value [m³/s] | Maximum [m³/s] | Minimum [m³/s] |
|---|---|---|---|
| 27.01.2024 | 2.83 | 3.09 | 2.61 |
| 26.01.2024 | 2.76 | 2.85 | 2.61 |
| 25.01.2024 | 3 | 3.21 | 2.61 |
| 24.01.2024 | 2.95 | 3.21 | 2.73 |
| 23.01.2024 | 2.85 | 3.07 | 2.48 |
| 22.01.2024 | 2.3 | 2.6 | 2.15 |
| 21.01.2024 | 2.31 | 2.37 | 2.26 |
© Bayerisches Landesamt für Umwelt 2024