
- Start >
- Rivers >
- Discharge >
- Iller - Lech - Bodensee >
- Wittislingen >
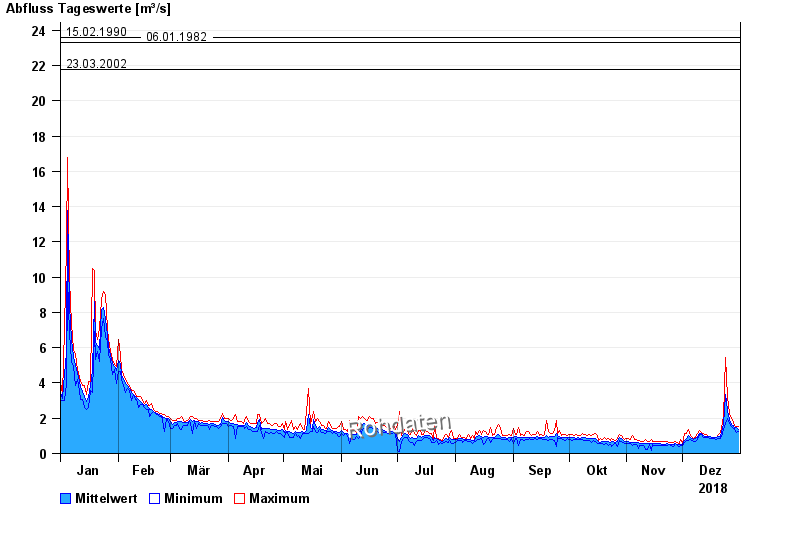
- Chart of year

Chart of year Wittislingen / Egau
Discharge from 01.01.2018 to 31.12.2018
- 14.04.1994 Abfluss: 32,2 m³/s
- 03.03.1956 Abfluss: 27,8 m³/s
- 15.02.1990 Abfluss: 23,6 m³/s
- 06.01.1982 Abfluss: 23,3 m³/s
- 23.03.2002 Abfluss: 21,8 m³/s
| Date | Mean value [m³/s] | Maximum [m³/s] | Minimum [m³/s] |
|---|---|---|---|
| 31.12.2018 | 1.38 | 1.51 | 1.27 |
| 30.12.2018 | 1.45 | 1.51 | 1.2 |
| 29.12.2018 | 1.44 | 1.6 | 1.35 |
| 28.12.2018 | 1.56 | 1.78 | 1.43 |
| 27.12.2018 | 1.66 | 1.97 | 1.51 |
| 26.12.2018 | 1.91 | 2.28 | 1.69 |
| 25.12.2018 | 2.46 | 3.2 | 1.97 |
© Bayerisches Landesamt für Umwelt 2024