
- Start >
- Rivers >
- Discharge >
- Iller - Lech - Bodensee >
- Waldstetten >
- Chart of year

Chart of year Waldstetten / Günz
Discharge from 25.10.2020 to 24.10.2021
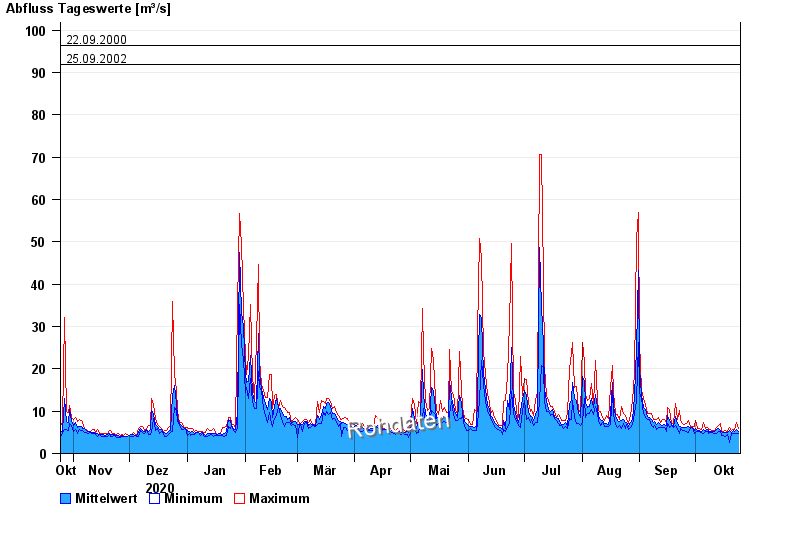
- 11.06.2013 Abfluss: 117 m³/s
- 12.08.2002 Abfluss: 111 m³/s
- 19.06.1991 Abfluss: 103 m³/s
- 22.09.2000 Abfluss: 96,5 m³/s
- 25.09.2002 Abfluss: 91,9 m³/s
| Date | Mean value [m³/s] | Maximum [m³/s] | Minimum [m³/s] |
|---|---|---|---|
| 24.10.2021 | 5.15 | 5.94 | 4.73 |
| 23.10.2021 | 5.77 | 7.29 | 4.73 |
| 22.10.2021 | 5.27 | 5.68 | 4.73 |
| 21.10.2021 | 5.35 | 5.68 | 4.73 |
| 20.10.2021 | 4.96 | 5.43 | 4.73 |
| 19.10.2021 | 5.37 | 6.19 | 2.55 |
| 18.10.2021 | 4.89 | 5.29 | 4.43 |
© Bayerisches Landesamt für Umwelt 2024