
- Start >
- Rivers >
- Discharge >
- Iller - Lech - Bodensee >
- Unterthingau >
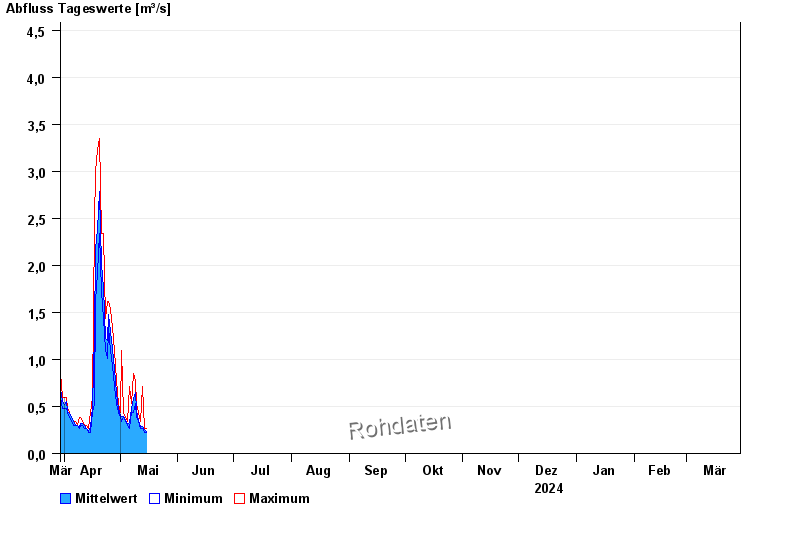
- Chart of year

Chart of year Unterthingau / Kirnach
Discharge from 30.03.2024 to 29.03.2025
- 21.05.1999 Abfluss: 49,5 m³/s
- 01.06.2013 Abfluss: 43,7 m³/s
- 30.06.2011 Abfluss: 38,2 m³/s
- 21.09.2000 Abfluss: 38 m³/s
- 12.08.2002 Abfluss: 37,4 m³/s
| Date | Mean value [m³/s] | Maximum [m³/s] | Minimum [m³/s] |
|---|---|---|---|
| 15.05.2024 | 0.23 | 0.262 | 0.228 |
| 14.05.2024 | 0.257 | 0.262 | 0.228 |
| 13.05.2024 | 0.282 | 0.715 | 0.262 |
| 12.05.2024 | 0.291 | 0.341 | 0.262 |
| 11.05.2024 | 0.352 | 0.432 | 0.341 |
| 10.05.2024 | 0.459 | 0.535 | 0.385 |
| 09.05.2024 | 0.646 | 0.781 | 0.535 |
© Bayerisches Landesamt für Umwelt 2024