
- Start >
- Rivers >
- Discharge >
- Iller - Lech - Bodensee >
- Unterthingau >
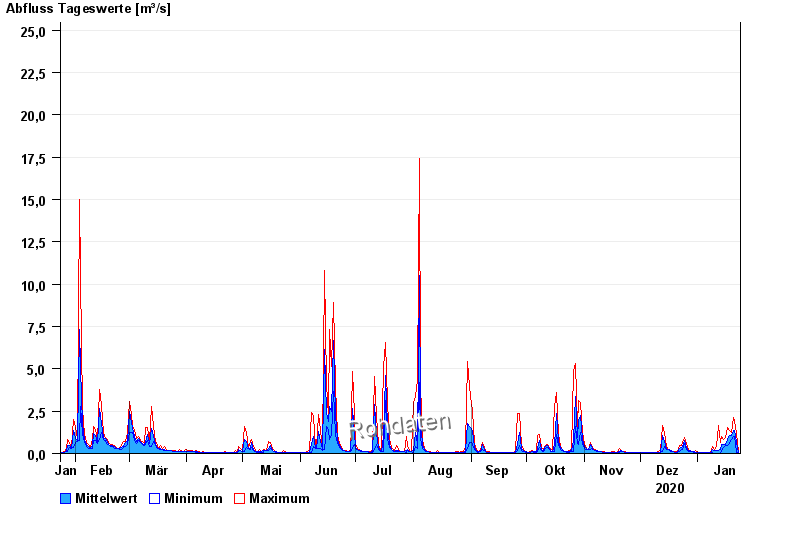
- Chart of year

Chart of year Unterthingau / Kirnach
Discharge from 24.01.2020 to 23.01.2021
- 21.05.1999 Abfluss: 49,5 m³/s
- 01.06.2013 Abfluss: 43,7 m³/s
- 30.06.2011 Abfluss: 38,2 m³/s
- 21.09.2000 Abfluss: 38 m³/s
- 12.08.2002 Abfluss: 37,4 m³/s
| Date | Mean value [m³/s] | Maximum [m³/s] | Minimum [m³/s] |
|---|---|---|---|
| 23.01.2021 | 0.071 | 0.092 | 0.058 |
| 22.01.2021 | 0.664 | 1.17 | 0.058 |
| 21.01.2021 | 1.35 | 1.93 | 1.01 |
| 20.01.2021 | 1.36 | 2.14 | 1.01 |
| 19.01.2021 | 1.06 | 1.26 | 0.846 |
| 18.01.2021 | 1.05 | 1.34 | 0.563 |
| 17.01.2021 | 0.801 | 1.54 | 0.5 |
© Bayerisches Landesamt für Umwelt 2024