
- Start >
- Rivers >
- Discharge >
- Iller - Lech - Bodensee >
- Unterthingau >
- Chart of year

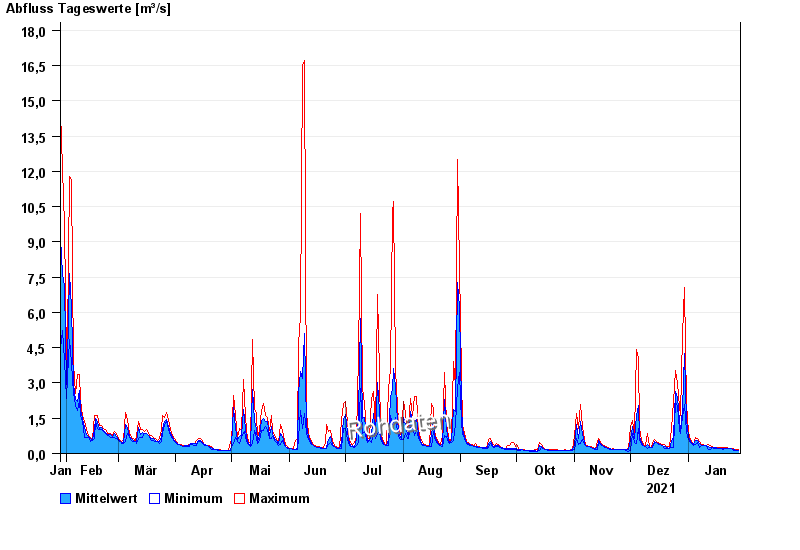
Chart of year Unterthingau / Kirnach
Discharge from 29.01.2021 to 28.01.2022
| Date | Mean value [m³/s] | Maximum [m³/s] | Minimum [m³/s] |
|---|---|---|---|
| 28.01.2022 | 0.142 | 0.164 | 0.14 |
| 27.01.2022 | 0.141 | 0.164 | 0.14 |
| 26.01.2022 | 0.15 | 0.164 | 0.14 |
| 25.01.2022 | 0.172 | 0.22 | 0.14 |
| 24.01.2022 | 0.22 | 0.22 | 0.22 |
| 23.01.2022 | 0.22 | 0.22 | 0.22 |
| 22.01.2022 | 0.221 | 0.252 | 0.22 |
© Bayerisches Landesamt für Umwelt 2024