
- Start >
- Rivers >
- Discharge >
- Iller - Lech - Bodensee >
- Unterthingau >
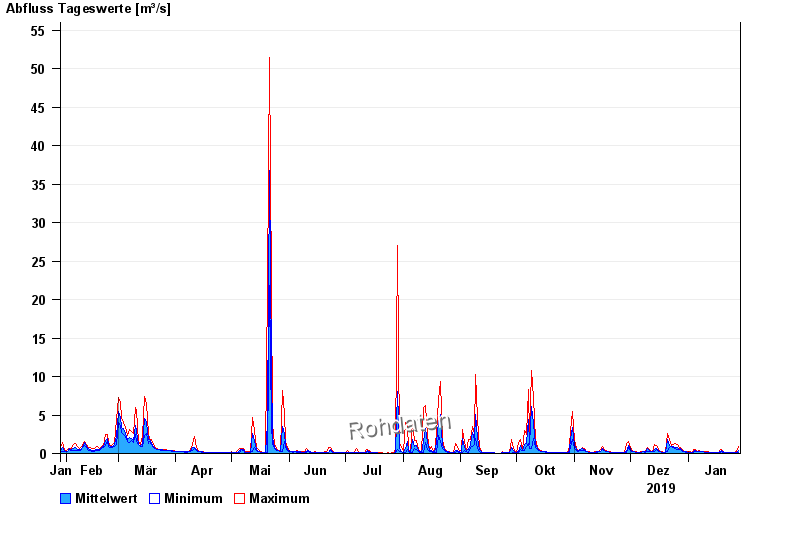
- Chart of year

Chart of year Unterthingau / Kirnach
Discharge from 29.01.2019 to 28.01.2020
| Date | Mean value [m³/s] | Maximum [m³/s] | Minimum [m³/s] |
|---|---|---|---|
| 28.01.2020 | 0.447 | 0.845 | 0.127 |
| 27.01.2020 | 0.116 | 0.276 | 0.106 |
| 26.01.2020 | 0.088 | 0.106 | 0.072 |
| 25.01.2020 | 0.088 | 0.088 | 0.088 |
| 24.01.2020 | 0.088 | 0.088 | 0.088 |
| 23.01.2020 | 0.103 | 0.106 | 0.088 |
| 22.01.2020 | 0.117 | 0.151 | 0.088 |
© Bayerisches Landesamt für Umwelt 2024