
- Start >
- Rivers >
- Discharge >
- Iller - Lech - Bodensee >
- Unterthingau >
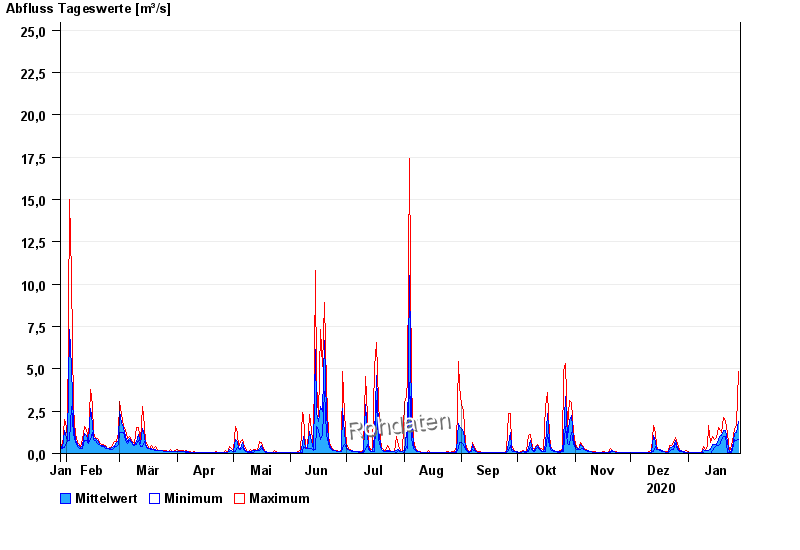
- Chart of year

Chart of year Unterthingau / Kirnach
Discharge from 29.01.2020 to 28.01.2021
- 21.05.1999 Abfluss: 49,5 m³/s
- 01.06.2013 Abfluss: 43,7 m³/s
- 30.06.2011 Abfluss: 38,2 m³/s
- 21.09.2000 Abfluss: 38 m³/s
- 12.08.2002 Abfluss: 37,4 m³/s
| Date | Mean value [m³/s] | Maximum [m³/s] | Minimum [m³/s] |
|---|---|---|---|
| 28.01.2021 | 1.91 | 4.83 | 0.846 |
| 27.01.2021 | 1.26 | 1.73 | 0.771 |
| 26.01.2021 | 1.2 | 1.44 | 0.846 |
| 25.01.2021 | 0.712 | 1.08 | 0.444 |
| 24.01.2021 | 0.154 | 0.444 | 0.074 |
| 23.01.2021 | 0.071 | 0.092 | 0.058 |
| 22.01.2021 | 0.664 | 1.17 | 0.058 |
© Bayerisches Landesamt für Umwelt 2024