
- Start >
- Rivers >
- Discharge >
- Iller - Lech - Bodensee >
- Unterthingau >
- Chart of year

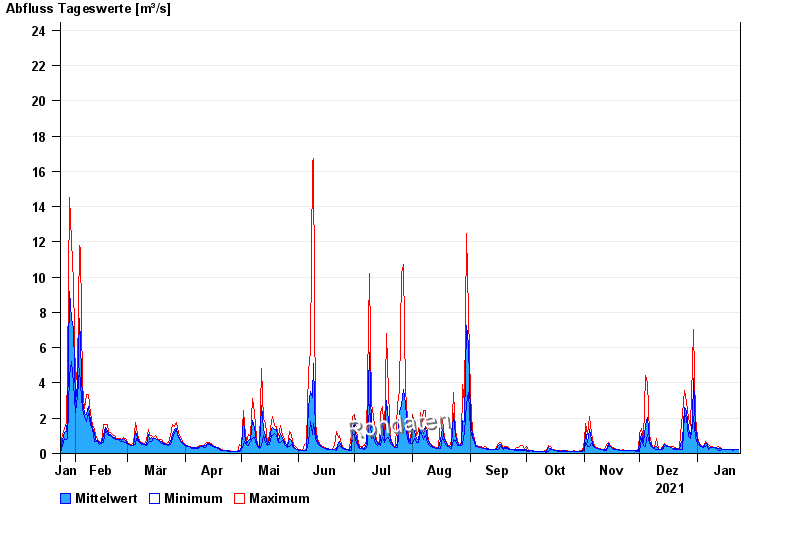
Chart of year Unterthingau / Kirnach
Discharge from 24.01.2021 to 23.01.2022
- 21.05.1999 Abfluss: 49,5 m³/s
- 01.06.2013 Abfluss: 43,7 m³/s
- 30.06.2011 Abfluss: 38,2 m³/s
- 21.09.2000 Abfluss: 38 m³/s
- 12.08.2002 Abfluss: 37,4 m³/s
| Date | Mean value [m³/s] | Maximum [m³/s] | Minimum [m³/s] |
|---|---|---|---|
| 23.01.2022 | 0.22 | 0.22 | 0.22 |
| 22.01.2022 | 0.221 | 0.252 | 0.22 |
| 21.01.2022 | 0.224 | 0.252 | 0.22 |
| 20.01.2022 | 0.227 | 0.252 | 0.19 |
| 19.01.2022 | 0.229 | 0.252 | 0.22 |
| 18.01.2022 | 0.224 | 0.252 | 0.22 |
| 17.01.2022 | 0.225 | 0.252 | 0.22 |
© Bayerisches Landesamt für Umwelt 2024