
- Start >
- Rivers >
- Discharge >
- Iller - Lech - Bodensee >
- Unterthingau >
- Chart of year

Chart of year Unterthingau / Kirnach
Discharge from 24.01.2019 to 23.01.2020
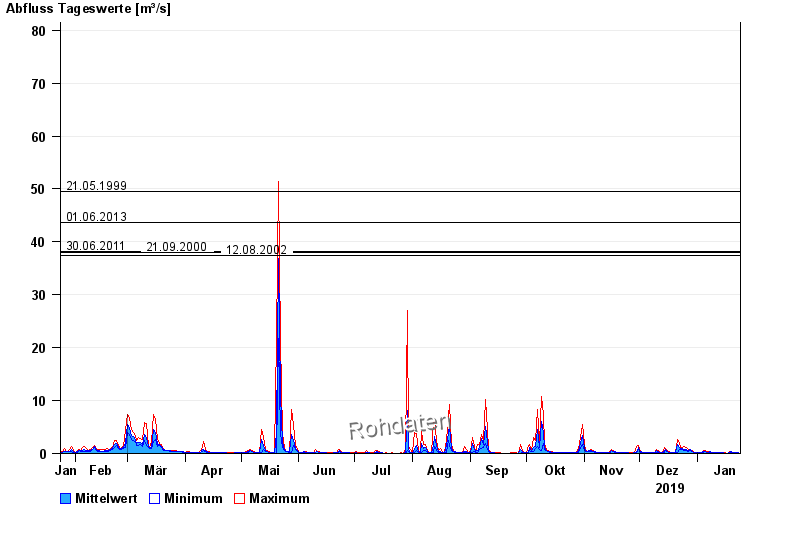
- 21.05.1999 Abfluss: 49,5 m³/s
- 01.06.2013 Abfluss: 43,7 m³/s
- 30.06.2011 Abfluss: 38,2 m³/s
- 21.09.2000 Abfluss: 38 m³/s
- 12.08.2002 Abfluss: 37,4 m³/s
| Date | Mean value [m³/s] | Maximum [m³/s] | Minimum [m³/s] |
|---|---|---|---|
| 23.01.2020 | 0.103 | 0.106 | 0.088 |
| 22.01.2020 | 0.117 | 0.151 | 0.088 |
| 21.01.2020 | 0.137 | 0.177 | 0.088 |
| 20.01.2020 | 0.214 | 0.276 | 0.177 |
| 19.01.2020 | 0.367 | 0.459 | 0.276 |
| 18.01.2020 | 0.238 | 0.459 | 0.088 |
| 17.01.2020 | 0.088 | 0.088 | 0.088 |
© Bayerisches Landesamt für Umwelt 2024