
- Start >
- Rivers >
- Discharge >
- Iller - Lech - Bodensee >
- Unterthingau >
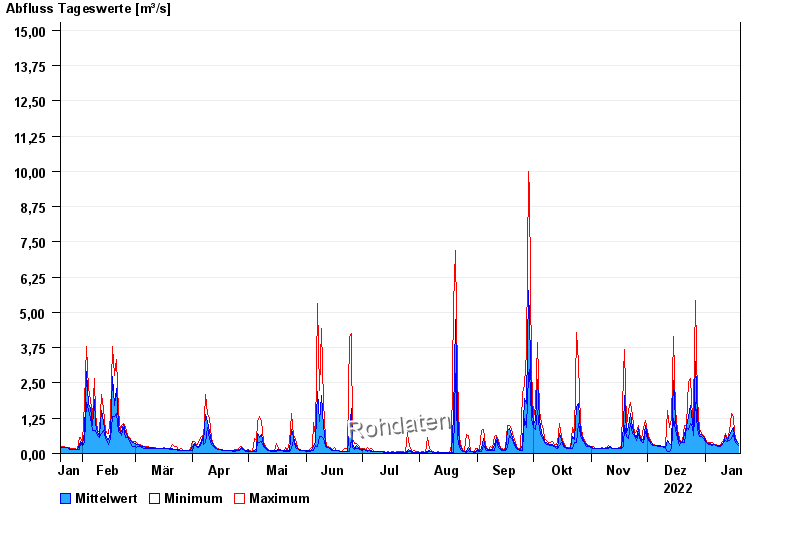
- Chart of year

Chart of year Unterthingau / Kirnach
Discharge from 20.01.2022 to 19.01.2023
- 21.05.1999 Abfluss: 49,5 m³/s
- 01.06.2013 Abfluss: 43,7 m³/s
- 30.06.2011 Abfluss: 38,2 m³/s
- 21.09.2000 Abfluss: 38 m³/s
- 12.08.2002 Abfluss: 37,4 m³/s
| Date | Mean value [m³/s] | Maximum [m³/s] | Minimum [m³/s] |
|---|---|---|---|
| 19.01.2023 | 0.34 | 0.372 | 0.287 |
| 18.01.2023 | 0.415 | 0.471 | 0.372 |
| 17.01.2023 | 0.561 | 0.707 | 0.471 |
| 16.01.2023 | 0.929 | 1.32 | 0.707 |
| 15.01.2023 | 0.771 | 1.42 | 0.532 |
| 14.01.2023 | 0.688 | 0.778 | 0.477 |
| 13.01.2023 | 0.461 | 0.532 | 0.426 |
© Bayerisches Landesamt für Umwelt 2024