
- Start >
- Rivers >
- Discharge >
- Iller - Lech - Bodensee >
- Unterthingau >
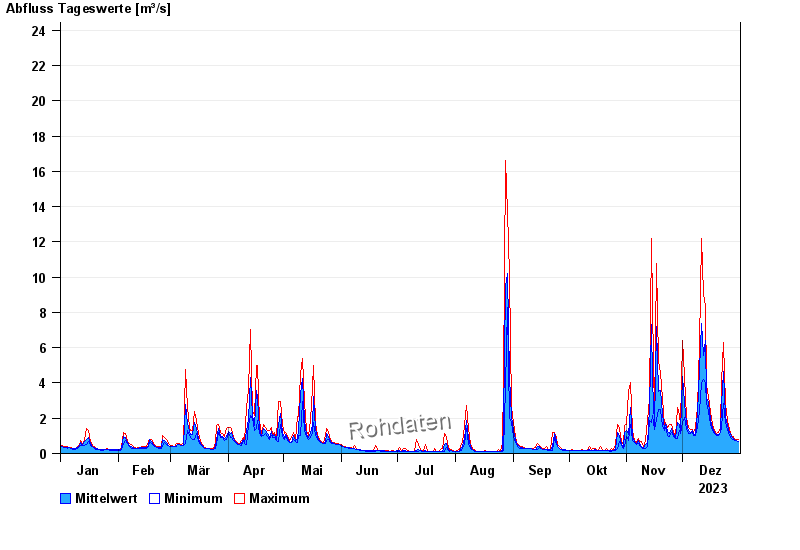
- Chart of year

Chart of year Unterthingau / Kirnach
Discharge from 01.01.2023 to 31.12.2023
- 21.05.1999 Abfluss: 49,5 m³/s
- 01.06.2013 Abfluss: 43,7 m³/s
- 30.06.2011 Abfluss: 38,2 m³/s
- 21.09.2000 Abfluss: 38 m³/s
- 12.08.2002 Abfluss: 37,4 m³/s
| Date | Mean value [m³/s] | Maximum [m³/s] | Minimum [m³/s] |
|---|---|---|---|
| 31.12.2023 | 0.701 | 0.8 | 0.668 |
| 30.12.2023 | 0.735 | 0.8 | 0.733 |
| 29.12.2023 | 0.79 | 0.8 | 0.733 |
| 28.12.2023 | 0.845 | 0.948 | 0.8 |
| 27.12.2023 | 0.974 | 1.03 | 0.871 |
| 26.12.2023 | 1.17 | 1.36 | 1.03 |
| 25.12.2023 | 1.56 | 1.85 | 1.36 |
© Bayerisches Landesamt für Umwelt 2024