
- Start >
- Rivers >
- Discharge >
- Iller - Lech - Bodensee >
- Unterthingau >
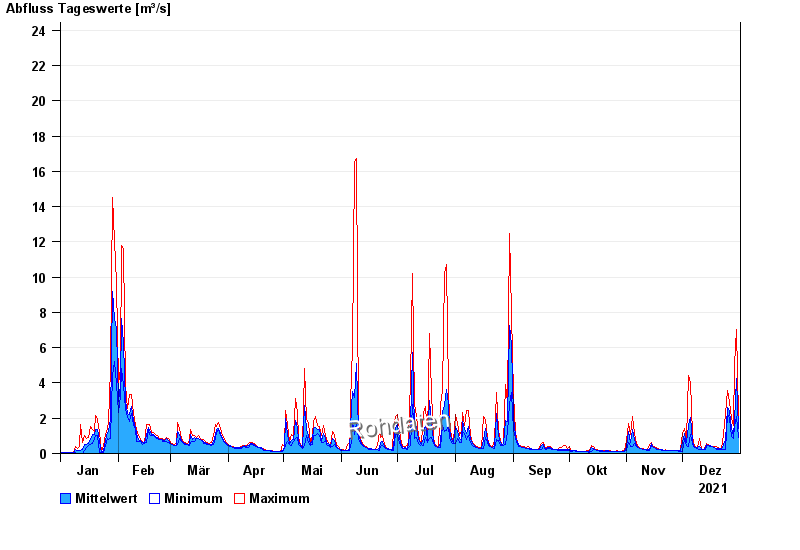
- Chart of year

Chart of year Unterthingau / Kirnach
Discharge from 01.01.2021 to 31.12.2021
- 21.05.1999 Abfluss: 49,5 m³/s
- 01.06.2013 Abfluss: 43,7 m³/s
- 30.06.2011 Abfluss: 38,2 m³/s
- 21.09.2000 Abfluss: 38 m³/s
- 12.08.2002 Abfluss: 37,4 m³/s
| Date | Mean value [m³/s] | Maximum [m³/s] | Minimum [m³/s] |
|---|---|---|---|
| 31.12.2021 | 1.39 | 2.1 | 0.908 |
| 30.12.2021 | 4.24 | 7.05 | 2.1 |
| 29.12.2021 | 1.85 | 5.04 | 1.51 |
| 28.12.2021 | 0.963 | 1.6 | 0.832 |
| 27.12.2021 | 1.4 | 2 | 0.986 |
| 26.12.2021 | 2.37 | 2.97 | 2 |
| 25.12.2021 | 2.63 | 3.55 | 2.21 |
© Bayerisches Landesamt für Umwelt 2024