
- Start >
- Rivers >
- Discharge >
- Iller - Lech - Bodensee >
- Unternogg >
- Chart of year

Chart of year Unternogg / Halbammer
Discharge from 01.01.2024 to 31.12.2024
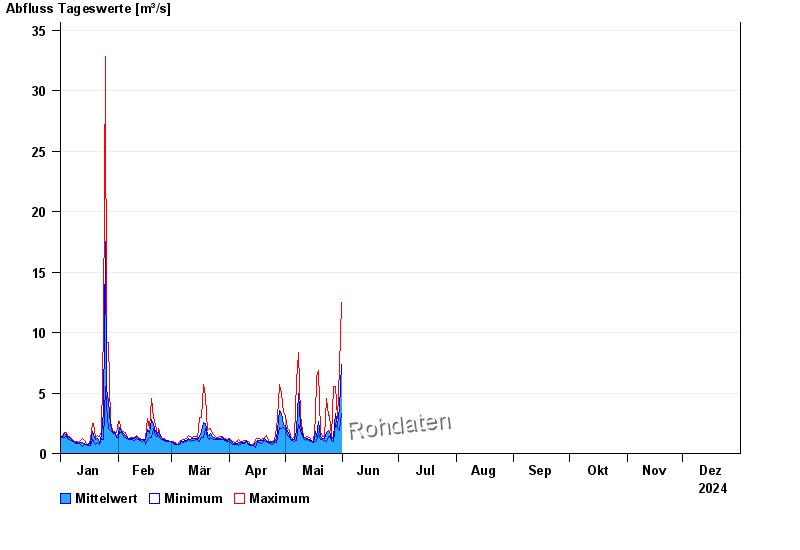
| Date | Mean value [m³/s] | Maximum [m³/s] | Minimum [m³/s] |
|---|---|---|---|
| 04.06.2024 | 6.59 | 8.6 | 4.37 |
| 03.06.2024 | 12.5 | 19.8 | 3.13 |
| 02.06.2024 | 5.87 | 10 | 3.13 |
| 01.06.2024 | 17.6 | 26 | 7.32 |
| 31.05.2024 | 7.36 | 12.5 | 3.27 |
| 30.05.2024 | 3.79 | 7.08 | 1.92 |
| 29.05.2024 | 2.34 | 2.87 | 2.03 |
© Bayerisches Landesamt für Umwelt 2024