
- Start >
- Rivers >
- Discharge >
- Iller - Lech - Bodensee >
- Türkheim >
- Chart of year

Chart of year Türkheim / Wertach
Discharge from 01.01.2022 to 31.12.2022
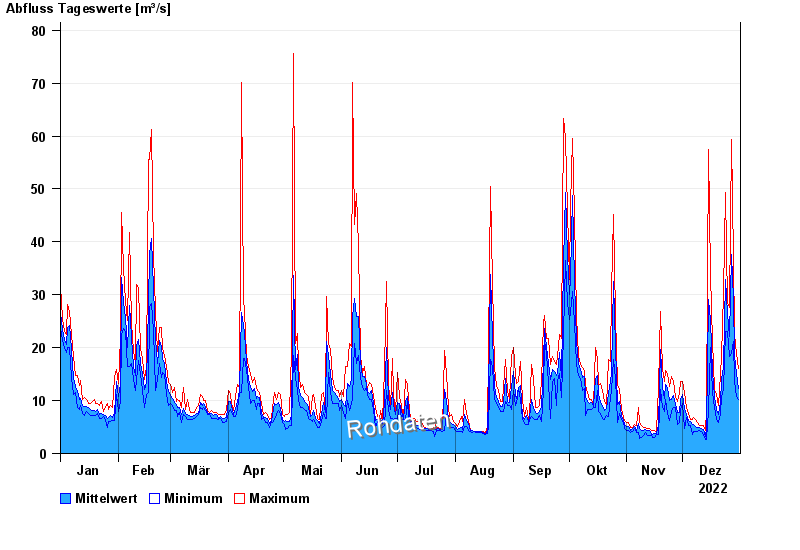
note
Beeinflussung durch Kraftwerksbetrieb
| Date | Mean value [m³/s] | Maximum [m³/s] | Minimum [m³/s] |
|---|---|---|---|
| 31.12.2022 | 12.3 | 16.1 | 10.3 |
| 30.12.2022 | 15.1 | 18.9 | 10.7 |
| 29.12.2022 | 18.5 | 22.5 | 13.6 |
| 28.12.2022 | 29.1 | 36.9 | 21.2 |
| 27.12.2022 | 37.6 | 59.4 | 18.9 |
| 26.12.2022 | 22.1 | 27.6 | 18.4 |
| 25.12.2022 | 26.4 | 28.3 | 23.1 |
© Bayerisches Landesamt für Umwelt 2024