
- Start >
- Rivers >
- Discharge >
- Iller - Lech - Bodensee >
- Türkheim >
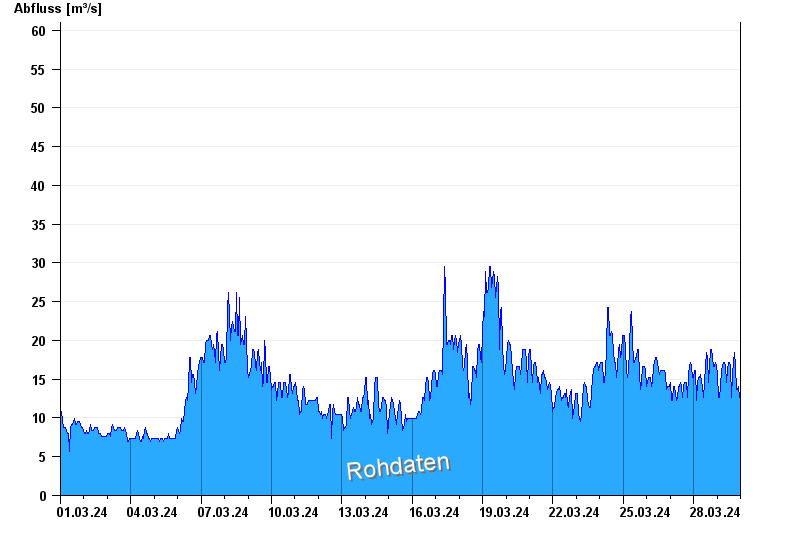
- Chart of month

Chart of month Türkheim / Wertach
Discharge from 01.03.2024 to 29.03.2024
note
Beeinflussung durch Kraftwerksbetrieb
- HQ1 144 m³/s
- HQ2 175 m³/s
- HQ5 210 m³/s
- HQ10 245 m³/s
- HQ20 280 m³/s
- HQ50 330 m³/s
- HQ100 370 m³/s
| Date | Runoff [m³/s] |
|---|---|
| 29.03.2024 23:45 | 12.7 |
| 29.03.2024 23:30 | 12.2 |
| 29.03.2024 23:15 | 12.2 |
| 29.03.2024 23:00 | 12.2 |
| 29.03.2024 22:45 | 12.2 |
| 29.03.2024 22:30 | 12.7 |
| 29.03.2024 22:15 | 13.1 |
© Bayerisches Landesamt für Umwelt 2024