
- Start >
- Rivers >
- Discharge >
- Iller - Lech - Bodensee >
- Trauchgau >
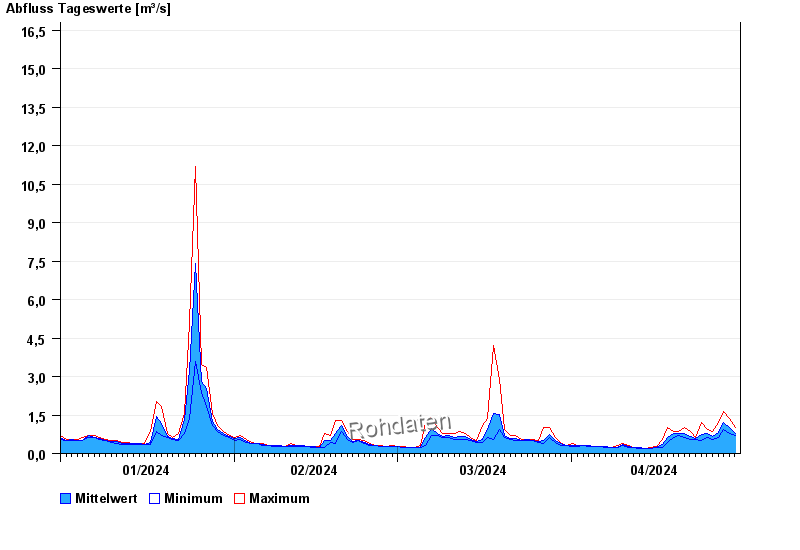
- Chart of year

Chart of year Trauchgau / Trauchgauer Ach
Discharge from 01.01.2024 to 30.04.2024
- 17.07.1993 Abfluss: 47,7 m³/s
- 19.08.1929 Abfluss: 47 m³/s
- 07.07.1946 Abfluss: 41,7 m³/s
- 23.08.1937 Abfluss: 41,2 m³/s
- 10.07.1932 Abfluss: 41 m³/s
| Date | Mean value [m³/s] | Maximum [m³/s] | Minimum [m³/s] |
|---|---|---|---|
| 30.04.2024 | 1.01 | 1.02 | 0.932 |
| 29.04.2024 | 0.999 | 1.37 | 0.774 |
| 28.04.2024 | 1.21 | 1.65 | 0.932 |
| 27.04.2024 | 0.825 | 1.19 | 0.628 |
| 26.04.2024 | 0.677 | 0.852 | 0.56 |
| 25.04.2024 | 0.789 | 0.932 | 0.628 |
| 24.04.2024 | 0.727 | 1.19 | 0.491 |
© Bayerisches Landesamt für Umwelt 2024