
- Start >
- Rivers >
- Discharge >
- Iller - Lech - Bodensee >
- Trauchgau >
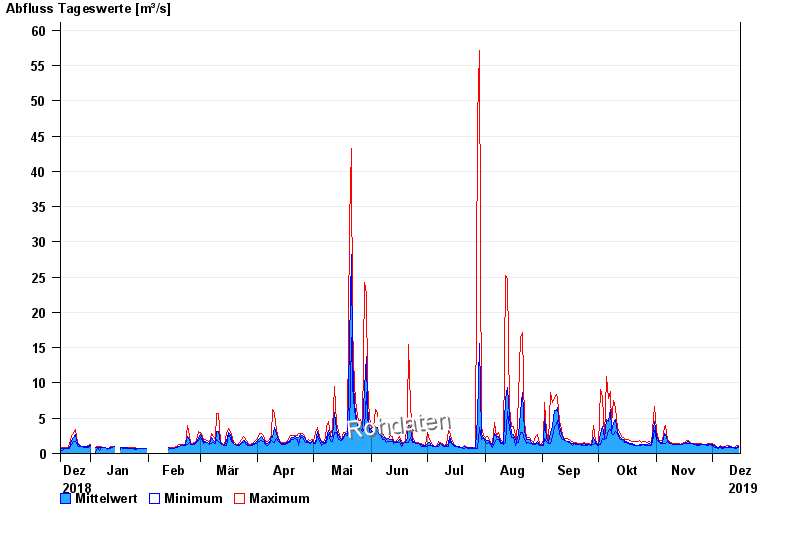
- Chart of year

Chart of year Trauchgau / Halblech
Discharge from 16.12.2018 to 15.12.2019
| Date | Mean value [m³/s] | Maximum [m³/s] | Minimum [m³/s] |
|---|---|---|---|
| 15.12.2019 | 0.989 | 1.08 | 0.908 |
| 14.12.2019 | 0.906 | 1.08 | 0.683 |
| 13.12.2019 | 0.849 | 0.908 | 0.683 |
| 12.12.2019 | 0.894 | 0.908 | 0.831 |
| 11.12.2019 | 0.98 | 0.993 | 0.908 |
| 10.12.2019 | 1.01 | 1.08 | 0.908 |
| 09.12.2019 | 0.918 | 1.08 | 0.831 |
© Bayerisches Landesamt für Umwelt 2024