
- Start >
- Rivers >
- Discharge >
- Iller - Lech - Bodensee >
- Trauchgau >
- Chart of year

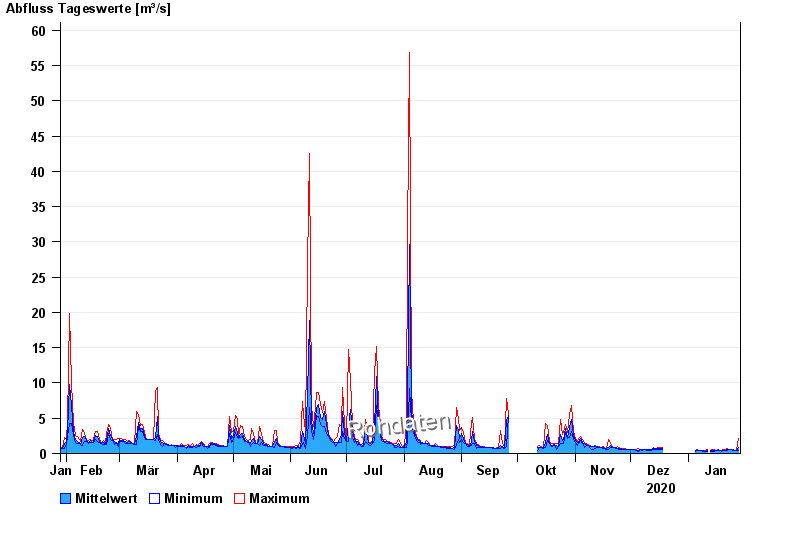
Chart of year Trauchgau / Halblech
Discharge from 29.01.2020 to 28.01.2021
| Date | Mean value [m³/s] | Maximum [m³/s] | Minimum [m³/s] |
|---|---|---|---|
| 28.01.2021 | 0.79 | 2.17 | 0.398 |
| 27.01.2021 | 0.447 | 0.448 | 0.398 |
| 26.01.2021 | 0.448 | 0.448 | 0.448 |
| 25.01.2021 | 0.48 | 0.502 | 0.448 |
| 24.01.2021 | 0.512 | 0.559 | 0.502 |
| 23.01.2021 | 0.579 | 0.622 | 0.559 |
| 22.01.2021 | 0.503 | 0.687 | 0.398 |
© Bayerisches Landesamt für Umwelt 2024