
- Start >
- Rivers >
- Discharge >
- Iller - Lech - Bodensee >
- Trauchgau >
- Chart of year

Chart of year Trauchgau / Halblech
Discharge from 27.01.2021 to 26.01.2022
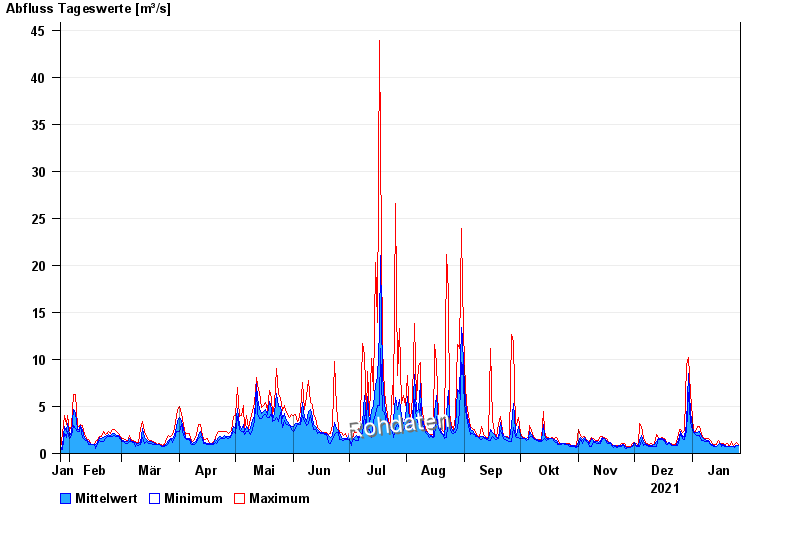
| Date | Mean value [m³/s] | Maximum [m³/s] | Minimum [m³/s] |
|---|---|---|---|
| 26.01.2022 | 0.901 | 0.92 | 0.842 |
| 25.01.2022 | 0.897 | 1.19 | 0.842 |
| 24.01.2022 | 0.766 | 0.92 | 0.625 |
| 23.01.2022 | 0.708 | 0.766 | 0.692 |
| 22.01.2022 | 0.791 | 1.29 | 0.692 |
| 21.01.2022 | 0.716 | 0.766 | 0.692 |
| 20.01.2022 | 0.772 | 1.1 | 0.692 |
© Bayerisches Landesamt für Umwelt 2024