
- Start >
- Rivers >
- Discharge >
- Iller - Lech - Bodensee >
- Trauchgau >
- Chart of year

Chart of year Trauchgau / Halblech
Discharge from 01.01.2023 to 31.12.2023
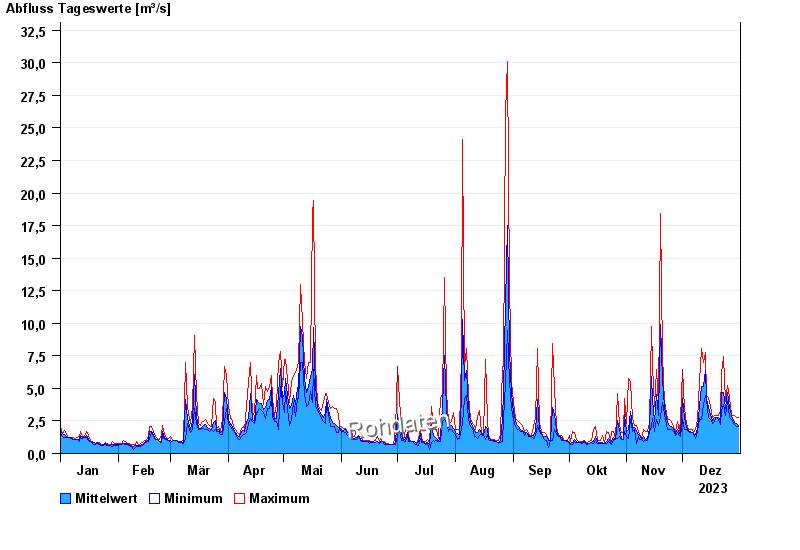
| Date | Mean value [m³/s] | Maximum [m³/s] | Minimum [m³/s] |
|---|---|---|---|
| 31.12.2023 | 2.18 | 2.74 | 2.08 |
| 30.12.2023 | 2.28 | 2.74 | 2.08 |
| 29.12.2023 | 2.41 | 2.88 | 2.21 |
| 28.12.2023 | 2.57 | 2.88 | 2.33 |
| 27.12.2023 | 2.91 | 3.03 | 2.6 |
| 26.12.2023 | 3.5 | 4.3 | 2.74 |
| 25.12.2023 | 4.65 | 5.19 | 3.96 |
© Bayerisches Landesamt für Umwelt 2024