
- Start >
- Rivers >
- Discharge >
- Iller - Lech - Bodensee >
- Trauchgau >
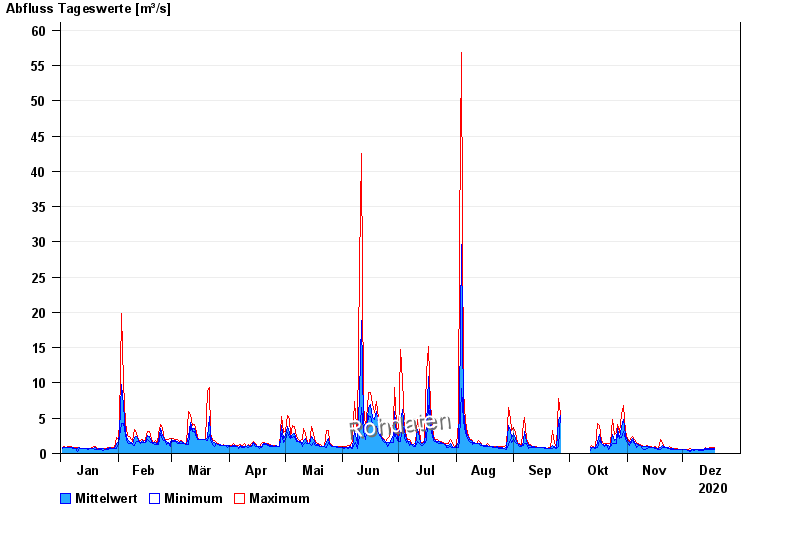
- Chart of year

Chart of year Trauchgau / Halblech
Discharge from 01.01.2020 to 31.12.2020
| Date | Mean value [m³/s] | Maximum [m³/s] | Minimum [m³/s] |
|---|---|---|---|
| 18.12.2020 | 0.661 | 0.829 | 0.559 |
| 17.12.2020 | 0.702 | 0.909 | 0.622 |
| 16.12.2020 | 0.709 | 0.909 | 0.622 |
| 15.12.2020 | 0.652 | 0.754 | 0.559 |
| 14.12.2020 | 0.655 | 0.754 | 0.622 |
| 13.12.2020 | 0.732 | 0.909 | 0.559 |
| 12.12.2020 | 0.51 | 0.559 | 0.448 |
© Bayerisches Landesamt für Umwelt 2024