
- Start >
- Rivers >
- Discharge >
- Iller - Lech - Bodensee >
- Trauchgau >
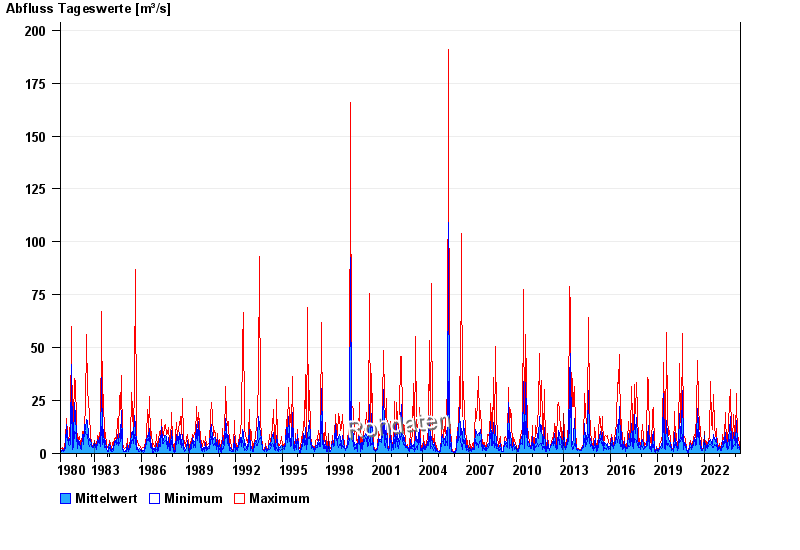
- Chart of total period

Chart of total period Trauchgau / Halblech
Discharge from 01.11.1980 to 26.04.2024
| Date | Mean value [m³/s] | Maximum [m³/s] | Minimum [m³/s] |
|---|---|---|---|
| 26.04.2024 | 1.53 | 2.18 | 1.27 |
| 25.04.2024 | 1.26 | 1.48 | 1.17 |
| 24.04.2024 | 1.2 | 1.27 | 1.17 |
| 23.04.2024 | 1.35 | 1.48 | 1.08 |
| 22.04.2024 | 1.48 | 1.48 | 1.38 |
| 21.04.2024 | 1.55 | 1.59 | 1.48 |
| 20.04.2024 | 1.84 | 2.05 | 1.48 |
© Bayerisches Landesamt für Umwelt 2024