
- Start >
- Rivers >
- Discharge >
- Iller - Lech - Bodensee >
- Thalhofen >
- Chart of year

Chart of year Thalhofen / Wertach
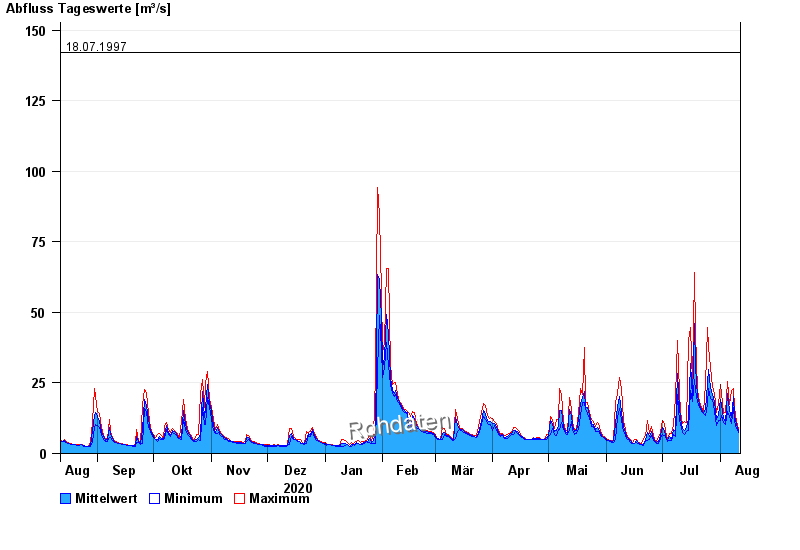
Discharge from 12.08.2020 to 11.08.2021
- 22.05.1999 Abfluss: 264 m³/s
- 23.08.2005 Abfluss: 202 m³/s
- 06.08.2000 Abfluss: 181 m³/s
- 02.06.2013 Abfluss: 163 m³/s
- 18.07.1997 Abfluss: 142 m³/s
| Date | Mean value [m³/s] | Maximum [m³/s] | Minimum [m³/s] |
|---|---|---|---|
| 11.08.2021 | 8.13 | 8.81 | 7.46 |
| 10.08.2021 | 10.1 | 11.4 | 8.81 |
| 09.08.2021 | 13.5 | 16.4 | 11.4 |
| 08.08.2021 | 20.3 | 23 | 16.4 |
| 07.08.2021 | 12.8 | 22.5 | 10.6 |
| 06.08.2021 | 15.2 | 17.5 | 13.1 |
| 05.08.2021 | 21.4 | 25.5 | 14.9 |
© Bayerisches Landesamt für Umwelt 2024