
- Start >
- Rivers >
- Discharge >
- Iller - Lech - Bodensee >
- Thalhofen >
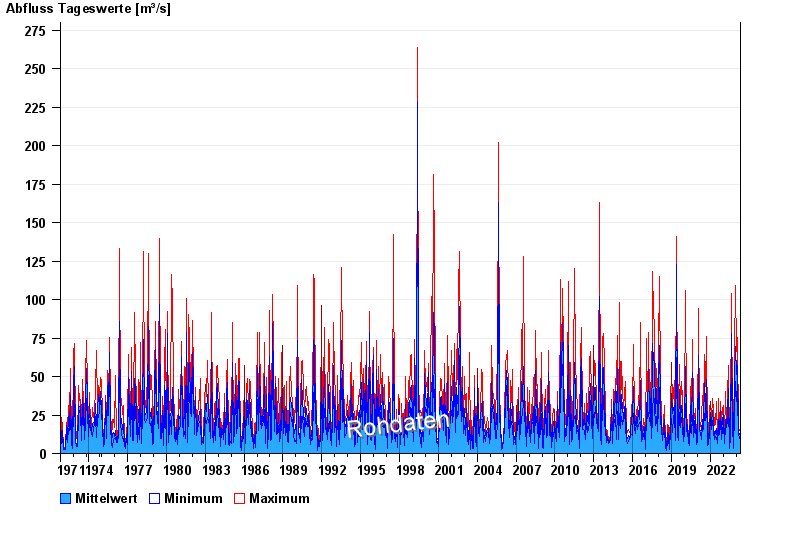
- Chart of total period

Chart of total period Thalhofen / Wertach
Discharge from 01.11.1971 to 26.04.2024
| Date | Mean value [m³/s] | Maximum [m³/s] | Minimum [m³/s] |
|---|---|---|---|
| 26.04.2024 | 12.8 | 13.3 | 12 |
| 25.04.2024 | 12.6 | 13.3 | 12 |
| 24.04.2024 | 10.5 | 12.9 | 8.94 |
| 23.04.2024 | 8.59 | 10.4 | 8.24 |
| 22.04.2024 | 9.79 | 11.6 | 8.94 |
| 21.04.2024 | 10.3 | 11.6 | 9.3 |
| 20.04.2024 | 11.2 | 12 | 10.8 |
© Bayerisches Landesamt für Umwelt 2024