
- Start >
- Rivers >
- Discharge >
- Iller - Lech - Bodensee >
- Stielings >
- Chart of year

Chart of year Stielings / Leubas
Discharge from 14.11.2019 to 13.11.2020
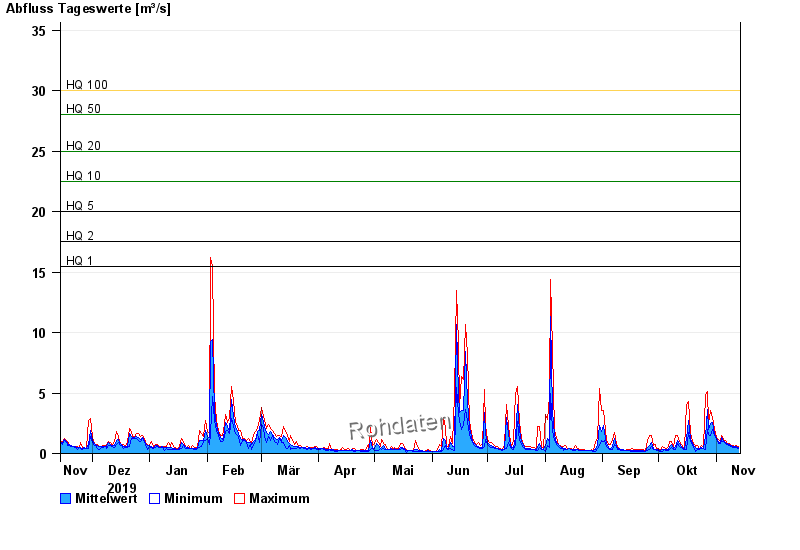
- HQ1 15,5 m³/s
- HQ2 17,5 m³/s
- HQ5 20 m³/s
- HQ10 22,5 m³/s
- HQ20 25 m³/s
- HQ50 28 m³/s
- HQ100 30 m³/s
| Date | Mean value [m³/s] | Maximum [m³/s] | Minimum [m³/s] |
|---|---|---|---|
| 13.11.2020 | 0.491 | 0.566 | 0.424 |
| 12.11.2020 | 0.539 | 0.65 | 0.491 |
| 11.11.2020 | 0.562 | 0.566 | 0.491 |
| 10.11.2020 | 0.587 | 0.65 | 0.491 |
| 09.11.2020 | 0.643 | 0.65 | 0.566 |
| 08.11.2020 | 0.71 | 0.847 | 0.65 |
| 07.11.2020 | 0.789 | 0.847 | 0.743 |
© Bayerisches Landesamt für Umwelt 2024