
- Start >
- Rivers >
- Discharge >
- Iller - Lech - Bodensee >
- Stielings >
- Chart of year

Chart of year Stielings / Leubas
Discharge from 06.12.2020 to 05.12.2021
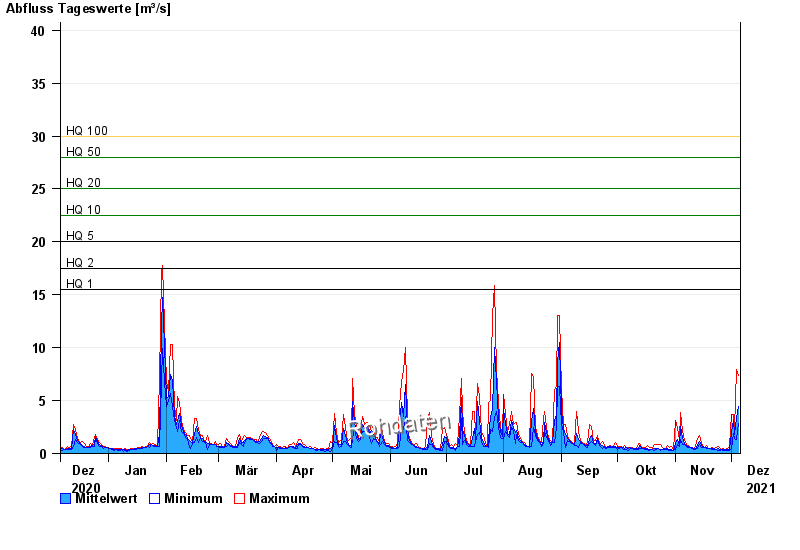
- HQ1 15,5 m³/s
- HQ2 17,5 m³/s
- HQ5 20 m³/s
- HQ10 22,5 m³/s
- HQ20 25 m³/s
- HQ50 28 m³/s
- HQ100 30 m³/s
| Date | Mean value [m³/s] | Maximum [m³/s] | Minimum [m³/s] |
|---|---|---|---|
| 05.12.2021 | 4.41 | 7.4 | 2.82 |
| 04.12.2021 | 3.35 | 7.94 | 1.32 |
| 03.12.2021 | 1.78 | 2.33 | 1.45 |
| 02.12.2021 | 3.11 | 3.71 | 1.88 |
| 01.12.2021 | 2 | 3.71 | 0.494 |
| 30.11.2021 | 0.416 | 0.647 | 0.284 |
| 29.11.2021 | 0.375 | 0.43 | 0.326 |
© Bayerisches Landesamt für Umwelt 2024