
- Start >
- Rivers >
- Discharge >
- Iller - Lech - Bodensee >
- Stielings >
- Chart of year

Chart of year Stielings / Leubas
Discharge from 01.01.2018 to 31.12.2018
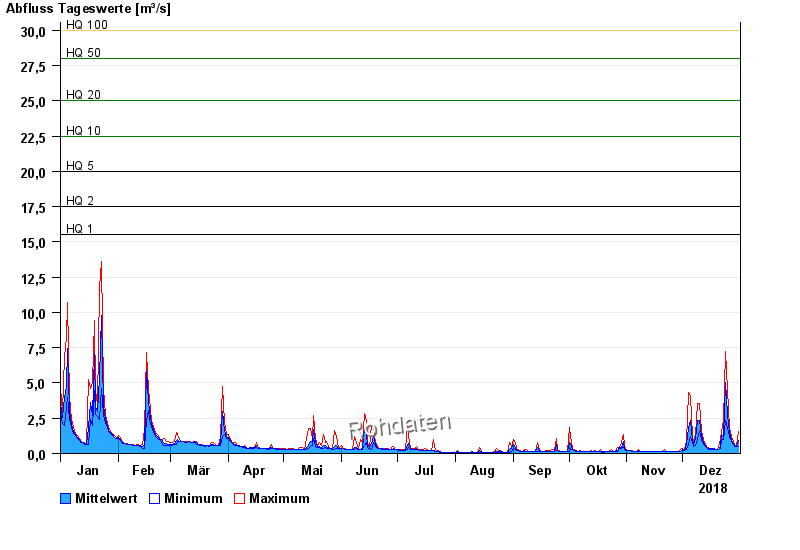
- HQ1 15,5 m³/s
- HQ2 17,5 m³/s
- HQ5 20 m³/s
- HQ10 22,5 m³/s
- HQ20 25 m³/s
- HQ50 28 m³/s
- HQ100 30 m³/s
| Date | Mean value [m³/s] | Maximum [m³/s] | Minimum [m³/s] |
|---|---|---|---|
| 31.12.2018 | 0.892 | 1.58 | 0.489 |
| 30.12.2018 | 0.506 | 0.566 | 0.489 |
| 29.12.2018 | 0.571 | 0.652 | 0.489 |
| 28.12.2018 | 0.72 | 0.85 | 0.652 |
| 27.12.2018 | 0.951 | 1.19 | 0.85 |
| 26.12.2018 | 1.5 | 1.87 | 1.19 |
| 25.12.2018 | 2.77 | 4.51 | 1.87 |
© Bayerisches Landesamt für Umwelt 2024