
- Start >
- Rivers >
- Discharge >
- Iller - Lech - Bodensee >
- Spielmannsau >
- Chart of year

Chart of year Spielmannsau / Traufbach
Discharge from 01.01.2014 to 31.12.2014
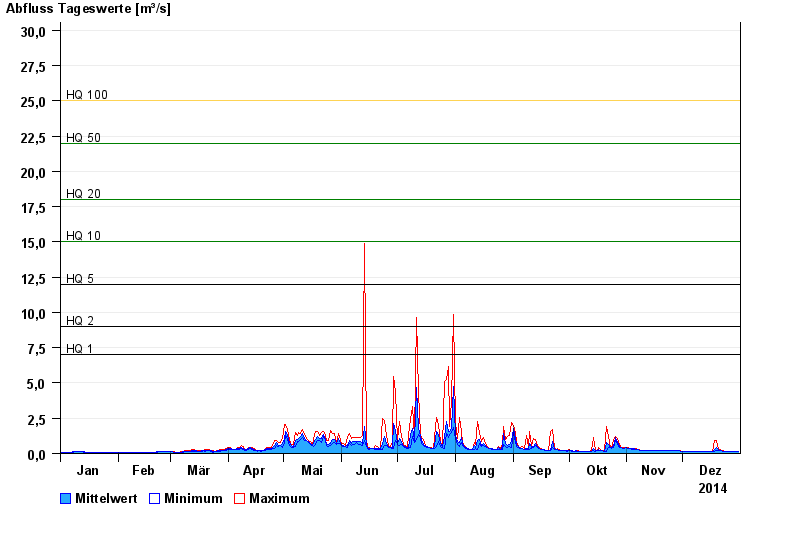
- HQ1 7 m³/s
- HQ2 9 m³/s
- HQ5 12 m³/s
- HQ10 15 m³/s
- HQ20 18 m³/s
- HQ50 22 m³/s
- HQ100 25 m³/s
| Date | Mean value [m³/s] | Maximum [m³/s] | Minimum [m³/s] |
|---|---|---|---|
| 31.12.2014 | 0.129 | 0.146 | 0.129 |
| 30.12.2014 | 0.146 | 0.146 | 0.146 |
| 29.12.2014 | 0.146 | 0.146 | 0.146 |
| 28.12.2014 | 0.146 | 0.146 | 0.146 |
| 27.12.2014 | 0.146 | 0.146 | 0.146 |
| 26.12.2014 | 0.149 | 0.165 | 0.146 |
| 25.12.2014 | 0.165 | 0.165 | 0.165 |
© Bayerisches Landesamt für Umwelt 2024