
- Start >
- Rivers >
- Discharge >
- Iller - Lech - Bodensee >
- Spielmannsau >
- Chart of month

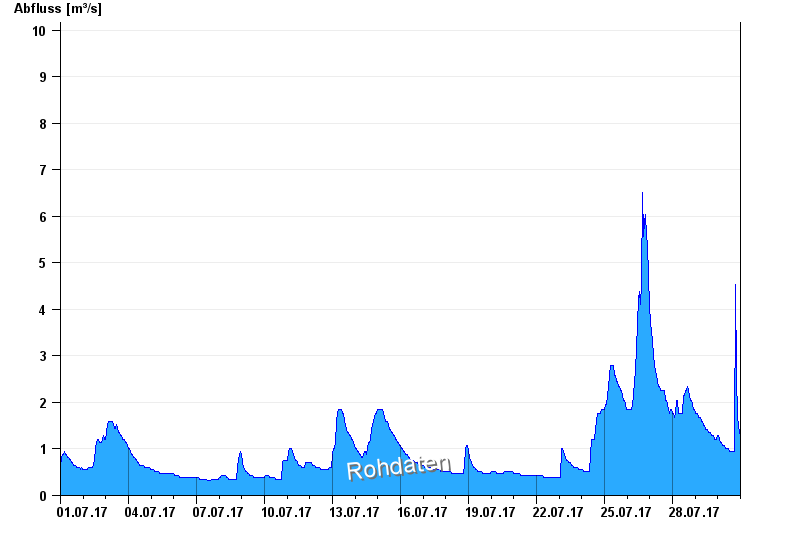
Chart of month Spielmannsau / Traufbach
Discharge from 01.07.2017 to 30.07.2017
- 25.07.1972 Abfluss: 46,6 m³/s
- 13.08.1990 Abfluss: 22,4 m³/s
- 10.10.2011 Abfluss: 21,1 m³/s
- 10.08.1970 Abfluss: 20,5 m³/s
- 22.05.1999 Abfluss: 20,4 m³/s
| Date | Runoff [m³/s] |
|---|---|
| 31.07.2017 00:45 | 1.14 |
| 31.07.2017 00:30 | 1.21 |
| 31.07.2017 00:15 | 1.21 |
| 31.07.2017 00:00 | 1.21 |
| 30.07.2017 23:45 | 1.21 |
| 30.07.2017 23:30 | 1.28 |
| 30.07.2017 23:15 | 1.28 |
© Bayerisches Landesamt für Umwelt 2024