
- Start >
- Rivers >
- Discharge >
- Iller - Lech - Bodensee >
- Sonthofen >
- Chart of year

Chart of year Sonthofen / Iller
Discharge from 15.05.2021 to 14.05.2022
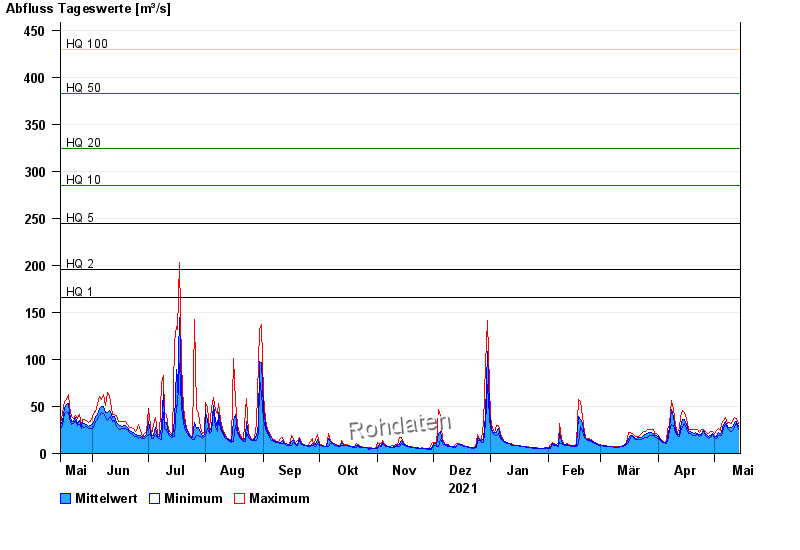
- HQ1 166 m³/s
- HQ2 196 m³/s
- HQ5 245 m³/s
- HQ10 285 m³/s
- HQ20 324 m³/s
- HQ50 383 m³/s
- HQ100 430 m³/s
| Date | Mean value [m³/s] | Maximum [m³/s] | Minimum [m³/s] |
|---|---|---|---|
| 14.05.2022 | 28.5 | 31.6 | 25.2 |
| 13.05.2022 | 33.8 | 36.8 | 31.6 |
| 12.05.2022 | 32.8 | 37.8 | 28.3 |
| 11.05.2022 | 29.6 | 35.9 | 25.2 |
| 10.05.2022 | 27.8 | 32.4 | 23.7 |
| 09.05.2022 | 28.1 | 33.3 | 24.4 |
| 08.05.2022 | 28.8 | 31.6 | 26.7 |
© Bayerisches Landesamt für Umwelt 2024