
- Start >
- Rivers >
- Discharge >
- Iller - Lech - Bodensee >
- Sonthofen >
- Chart of year

Chart of year Sonthofen / Iller
Discharge from 01.01.2024 to 26.04.2024
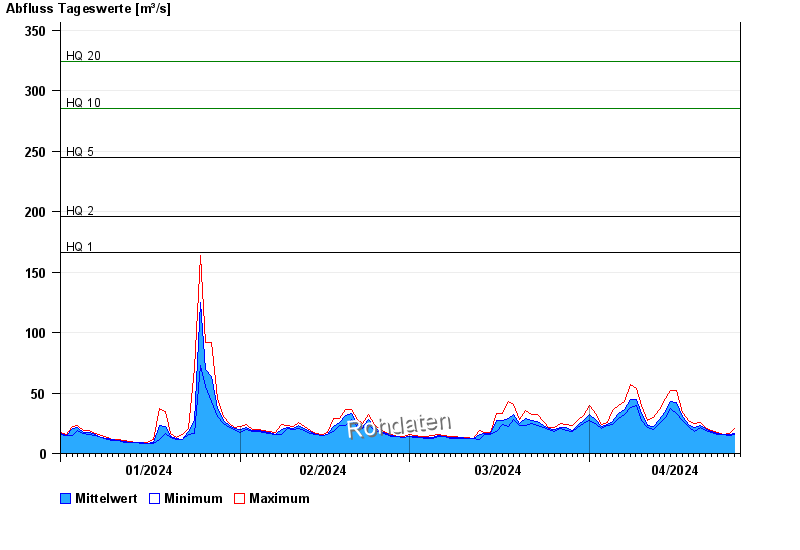
- HQ1 166 m³/s
- HQ2 196 m³/s
- HQ5 245 m³/s
- HQ10 285 m³/s
- HQ20 324 m³/s
- HQ50 383 m³/s
- HQ100 430 m³/s
| Date | Mean value [m³/s] | Maximum [m³/s] | Minimum [m³/s] |
|---|---|---|---|
| 26.04.2024 | 16 | 16.1 | 15.5 |
| 25.04.2024 | 15.7 | 16.7 | 15 |
| 24.04.2024 | 15.9 | 16.1 | 15.5 |
| 23.04.2024 | 16.7 | 17.3 | 16.1 |
| 22.04.2024 | 18.1 | 19.2 | 17.3 |
| 21.04.2024 | 20.6 | 21.9 | 19.2 |
| 20.04.2024 | 23.2 | 25.5 | 21.9 |
© Bayerisches Landesamt für Umwelt 2024