
- Start >
- Rivers >
- Discharge >
- Iller - Lech - Bodensee >
- Schöllang >
- Chart of year

Chart of year Schöllang / Eybach
Discharge from 24.10.2021 to 23.10.2022
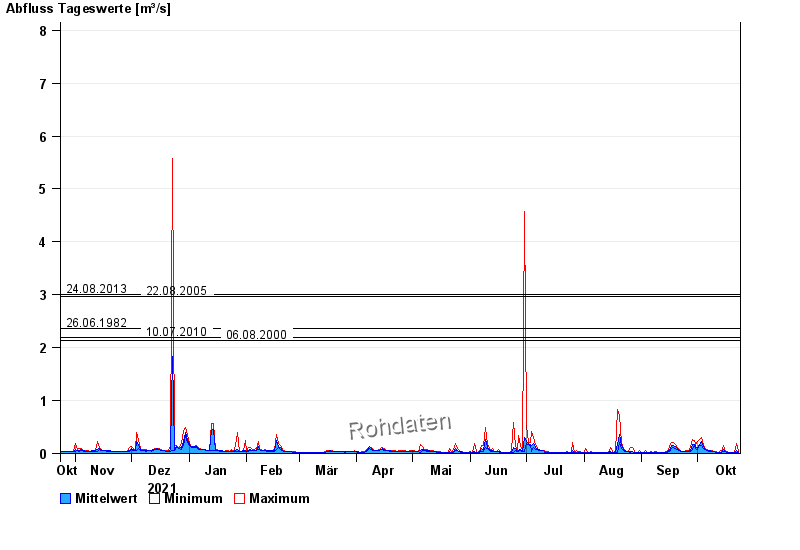
- 24.08.2013 Abfluss: 3 m³/s
- 22.08.2005 Abfluss: 2,97 m³/s
- 26.06.1982 Abfluss: 2,37 m³/s
- 10.07.2010 Abfluss: 2,19 m³/s
- 06.08.2000 Abfluss: 2,13 m³/s
| Date | Mean value [m³/s] | Maximum [m³/s] | Minimum [m³/s] |
|---|---|---|---|
| 23.10.2022 | 0.029 | 0.033 | 0.025 |
| 22.10.2022 | 0.06 | 0.189 | 0.023 |
| 21.10.2022 | 0.021 | 0.025 | 0.018 |
| 20.10.2022 | 0.023 | 0.025 | 0.02 |
| 19.10.2022 | 0.024 | 0.027 | 0.023 |
| 18.10.2022 | 0.024 | 0.025 | 0.023 |
| 17.10.2022 | 0.027 | 0.031 | 0.023 |
© Bayerisches Landesamt für Umwelt 2024