
- Start >
- Rivers >
- Discharge >
- Iller - Lech - Bodensee >
- Schöllang >
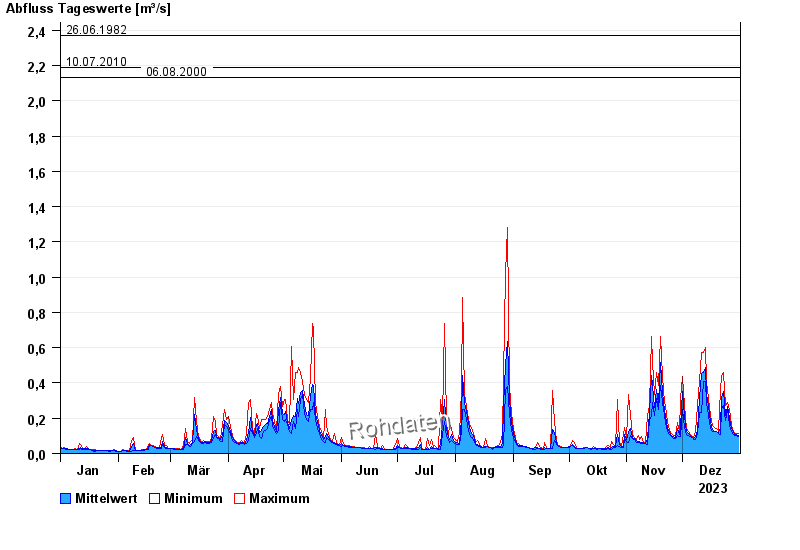
- Chart of year

Chart of year Schöllang / Eybach
Discharge from 01.01.2023 to 31.12.2023
- 24.08.2013 Abfluss: 3 m³/s
- 22.08.2005 Abfluss: 2,97 m³/s
- 26.06.1982 Abfluss: 2,37 m³/s
- 10.07.2010 Abfluss: 2,19 m³/s
- 06.08.2000 Abfluss: 2,13 m³/s
| Date | Mean value [m³/s] | Maximum [m³/s] | Minimum [m³/s] |
|---|---|---|---|
| 31.12.2023 | 0.101 | 0.116 | 0.096 |
| 30.12.2023 | 0.107 | 0.116 | 0.102 |
| 29.12.2023 | 0.109 | 0.116 | 0.102 |
| 28.12.2023 | 0.117 | 0.123 | 0.109 |
| 27.12.2023 | 0.141 | 0.161 | 0.123 |
| 26.12.2023 | 0.198 | 0.251 | 0.161 |
| 25.12.2023 | 0.269 | 0.291 | 0.251 |
© Bayerisches Landesamt für Umwelt 2024