
- Start >
- Rivers >
- Discharge >
- Iller - Lech - Bodensee >
- Schöllang >
- Chart of year

Chart of year Schöllang / Eybach
Discharge from 01.01.2021 to 31.12.2021
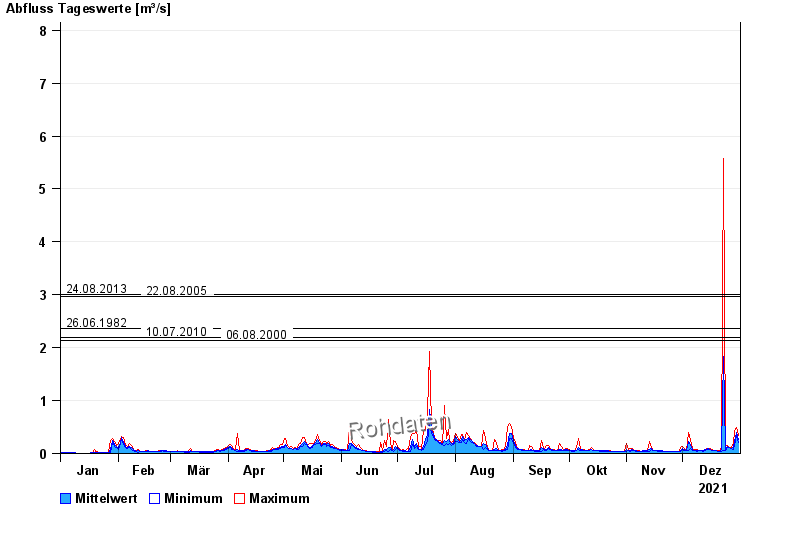
- 24.08.2013 Abfluss: 3 m³/s
- 22.08.2005 Abfluss: 2,97 m³/s
- 26.06.1982 Abfluss: 2,37 m³/s
- 10.07.2010 Abfluss: 2,19 m³/s
- 06.08.2000 Abfluss: 2,13 m³/s
| Date | Mean value [m³/s] | Maximum [m³/s] | Minimum [m³/s] |
|---|---|---|---|
| 31.12.2021 | 0.256 | 0.332 | 0.214 |
| 30.12.2021 | 0.406 | 0.485 | 0.332 |
| 29.12.2021 | 0.218 | 0.431 | 0.149 |
| 28.12.2021 | 0.119 | 0.198 | 0.083 |
| 27.12.2021 | 0.102 | 0.121 | 0.089 |
| 26.12.2021 | 0.118 | 0.121 | 0.108 |
| 25.12.2021 | 0.13 | 0.159 | 0.114 |
© Bayerisches Landesamt für Umwelt 2024