
- Start >
- Rivers >
- Discharge >
- Iller - Lech - Bodensee >
- Schöllang >
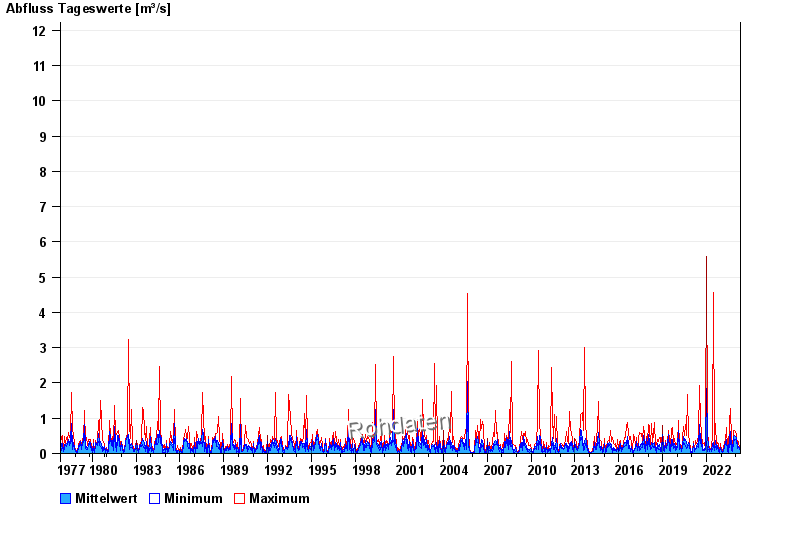
- Chart of total period

Chart of total period Schöllang / Eybach
Discharge from 01.11.1977 to 26.04.2024
 Für diesen Pegel sind keine Jährlichkeiten hinterlegt.
| Date | Mean value [m³/s] | Maximum [m³/s] | Minimum [m³/s] |
|---|---|---|---|
| 26.04.2024 | 0.078 | 0.08 | 0.075 |
| 25.04.2024 | 0.072 | 0.086 | 0.065 |
| 24.04.2024 | 0.071 | 0.075 | 0.07 |
| 23.04.2024 | 0.073 | 0.075 | 0.07 |
| 22.04.2024 | 0.078 | 0.08 | 0.075 |
| 21.04.2024 | 0.085 | 0.092 | 0.08 |
| 20.04.2024 | 0.093 | 0.104 | 0.086 |
© Bayerisches Landesamt für Umwelt 2024