
- Start >
- Rivers >
- Discharge >
- Iller - Lech - Bodensee >
- Pfronten Ried >
- Chart of year

Chart of year Pfronten Ried / Vils
Discharge from 17.06.2020 to 16.06.2021
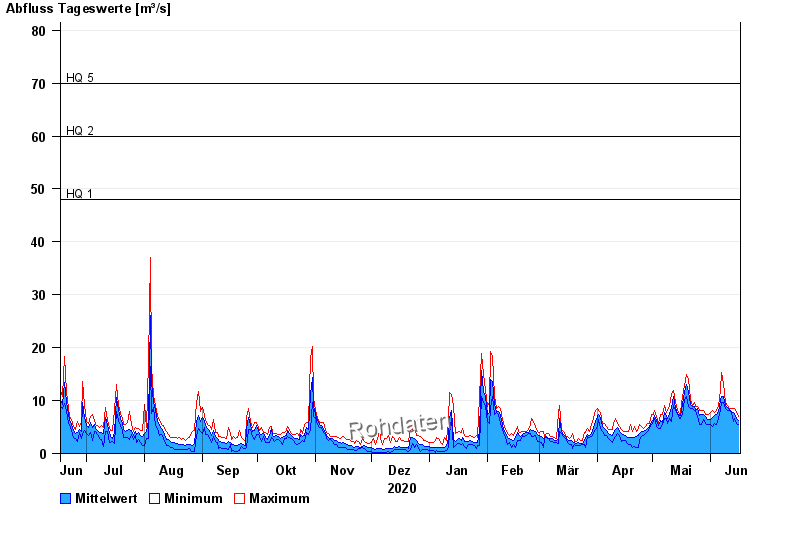
- HQ1 48 m³/s
- HQ2 60 m³/s
- HQ5 70 m³/s
- HQ10 85 m³/s
- HQ20 100 m³/s
- HQ50 120 m³/s
- HQ100 140 m³/s
| Date | Mean value [m³/s] | Maximum [m³/s] | Minimum [m³/s] |
|---|---|---|---|
| 16.06.2021 | 6.22 | 7 | 5.39 |
| 15.06.2021 | 6.64 | 7.71 | 5.7 |
| 14.06.2021 | 7.33 | 8.43 | 6.67 |
| 13.06.2021 | 7.72 | 8.43 | 6.02 |
| 12.06.2021 | 7.96 | 8.43 | 7.71 |
| 11.06.2021 | 8.34 | 8.43 | 8.06 |
| 10.06.2021 | 8.63 | 9.16 | 8.06 |
© Bayerisches Landesamt für Umwelt 2024