
- Start >
- Rivers >
- Discharge >
- Iller - Lech - Bodensee >
- Pfronten Ried >
- Chart of year

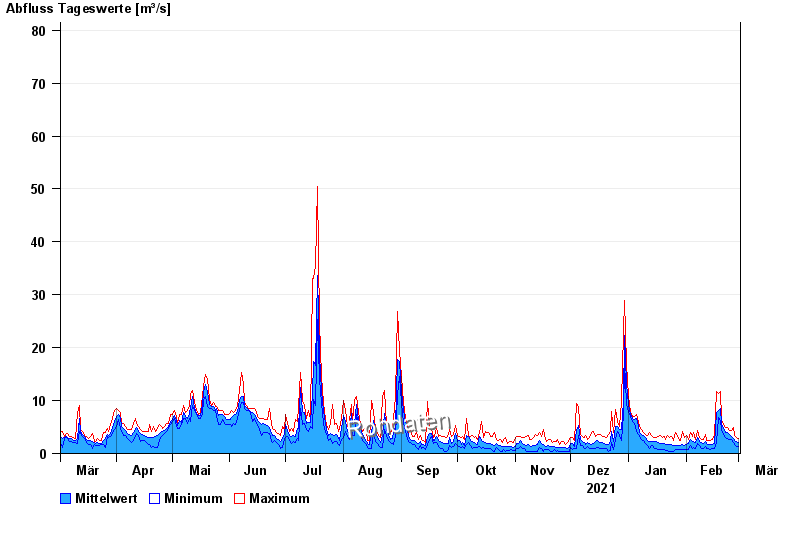
Chart of year Pfronten Ried / Vils
Discharge from 02.03.2021 to 01.03.2022
- 22.05.1999 Abfluss: 160 m³/s
- 10.08.1970 Abfluss: 147 m³/s
- 22.08.2005 Abfluss: 127 m³/s
- 06.08.2000 Abfluss: 123 m³/s
- 12.08.2002 Abfluss: 116 m³/s
| Date | Mean value [m³/s] | Maximum [m³/s] | Minimum [m³/s] |
|---|---|---|---|
| 01.03.2022 | 2.12 | 2.85 | 1.39 |
| 28.02.2022 | 2.29 | 3.08 | 1.25 |
| 27.02.2022 | 2.51 | 3.32 | 1.69 |
| 26.02.2022 | 2.83 | 4.93 | 2.03 |
| 25.02.2022 | 3.24 | 4.37 | 2.63 |
| 24.02.2022 | 3.6 | 4.37 | 2.63 |
| 23.02.2022 | 3.96 | 4.93 | 2.85 |
© Bayerisches Landesamt für Umwelt 2024