
- Start >
- Rivers >
- Discharge >
- Iller - Lech - Bodensee >
- Pfronten Ried >
- Chart of year

Chart of year Pfronten Ried / Vils
Discharge from 22.09.2019 to 21.09.2020
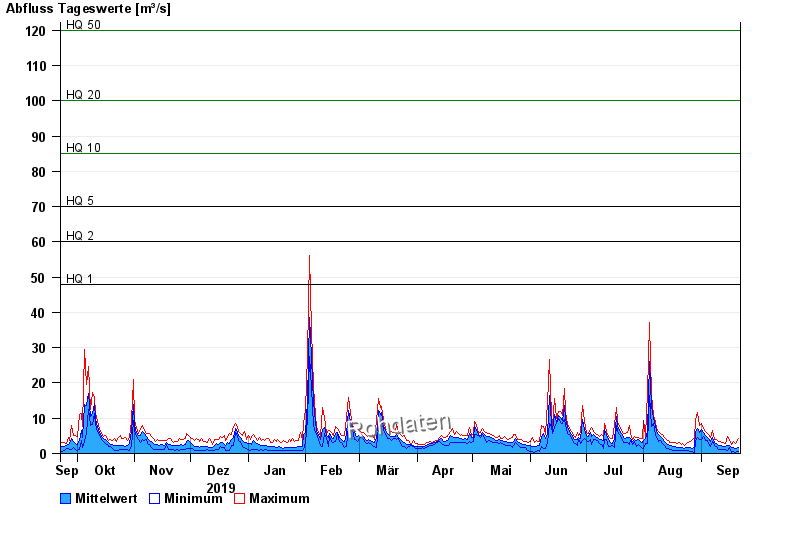
- HQ1 48 m³/s
- HQ2 60 m³/s
- HQ5 70 m³/s
- HQ10 85 m³/s
- HQ20 100 m³/s
- HQ50 120 m³/s
- HQ100 140 m³/s
| Date | Mean value [m³/s] | Maximum [m³/s] | Minimum [m³/s] |
|---|---|---|---|
| 21.09.2020 | 1.78 | 4.3 | 0.494 |
| 20.09.2020 | 1.47 | 3.03 | 0.447 |
| 19.09.2020 | 1.49 | 2.8 | 0.405 |
| 18.09.2020 | 1.61 | 3.27 | 0.494 |
| 17.09.2020 | 1.68 | 2.59 | 0.405 |
| 16.09.2020 | 2.16 | 3.77 | 1.65 |
| 15.09.2020 | 2.25 | 4.87 | 0.737 |
© Bayerisches Landesamt für Umwelt 2024