
- Start >
- Rivers >
- Discharge >
- Iller - Lech - Bodensee >
- Pfronten Ried >
- Chart of year

Chart of year Pfronten Ried / Vils
Discharge from 12.08.2018 to 11.08.2019
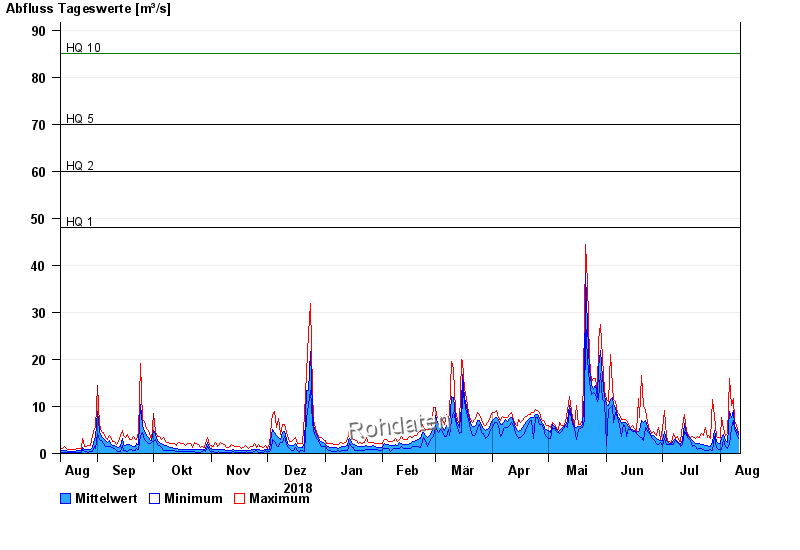
- HQ1 48 m³/s
- HQ2 60 m³/s
- HQ5 70 m³/s
- HQ10 85 m³/s
- HQ20 100 m³/s
- HQ50 120 m³/s
- HQ100 140 m³/s
| Date | Mean value [m³/s] | Maximum [m³/s] | Minimum [m³/s] |
|---|---|---|---|
| 11.08.2019 | 4.12 | 4.45 | 3.15 |
| 10.08.2019 | 4.82 | 5.94 | 4.17 |
| 09.08.2019 | 5.89 | 6.92 | 5.03 |
| 08.08.2019 | 9.07 | 11.8 | 6.92 |
| 07.08.2019 | 7.76 | 10.2 | 5.33 |
| 06.08.2019 | 9 | 16 | 2.07 |
| 05.08.2019 | 2.31 | 4.17 | 1.04 |
© Bayerisches Landesamt für Umwelt 2024