
- Start >
- Rivers >
- Discharge >
- Iller - Lech - Bodensee >
- Pfronten Ried >
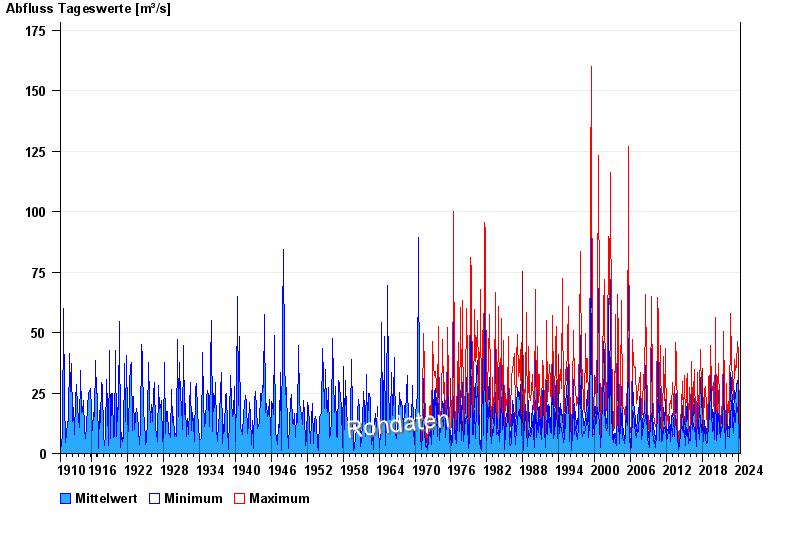
- Chart of total period

Chart of total period Pfronten Ried / Vils
Discharge from 01.11.1910 to 27.04.2024
| Date | Mean value [m³/s] | Maximum [m³/s] | Minimum [m³/s] |
|---|---|---|---|
| 27.04.2024 | 3.97 | 4.53 | 3.72 |
| 26.04.2024 | 3.23 | 5.41 | 1.2 |
| 25.04.2024 | 2.63 | 4.82 | 0.98 |
| 24.04.2024 | 2.68 | 5.41 | 0.8 |
| 23.04.2024 | 2.85 | 4.26 | 1.62 |
| 22.04.2024 | 3.18 | 3.72 | 1.62 |
| 21.04.2024 | 3.55 | 4.26 | 2.55 |
© Bayerisches Landesamt für Umwelt 2024