
- Start >
- Rivers >
- Discharge >
- Iller - Lech - Bodensee >
- Pfaffenhofen >
- Chart of year

Chart of year Pfaffenhofen / Zusam
Discharge from 01.01.2024 to 03.05.2024
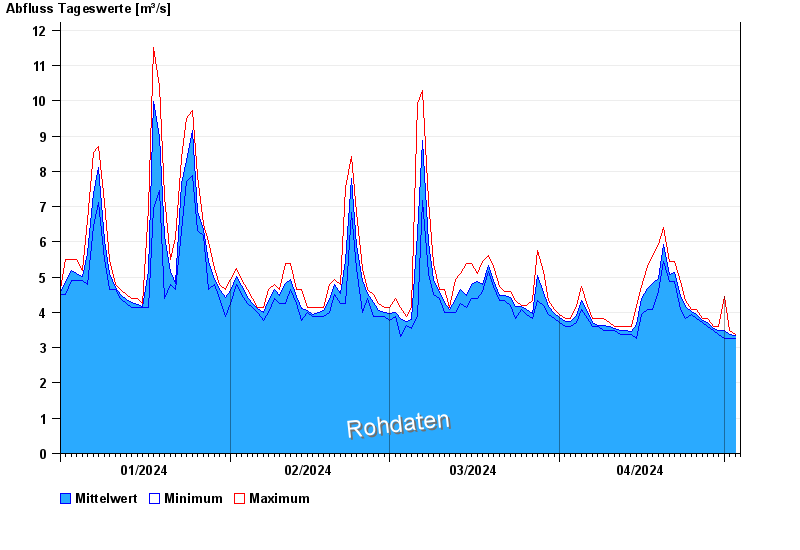
| Date | Mean value [m³/s] | Maximum [m³/s] | Minimum [m³/s] |
|---|---|---|---|
| 03.05.2024 | 3.38 | 3.38 | 3.38 |
| 02.05.2024 | 3.38 | 3.49 | 3.27 |
| 01.05.2024 | 3.48 | 4.46 | 3.27 |
| 30.04.2024 | 3.49 | 3.6 | 3.38 |
| 29.04.2024 | 3.54 | 3.6 | 3.49 |
| 28.04.2024 | 3.7 | 3.83 | 3.6 |
| 27.04.2024 | 3.76 | 3.83 | 3.72 |
© Bayerisches Landesamt für Umwelt 2024