
- Start >
- Rivers >
- Discharge >
- Iller - Lech - Bodensee >
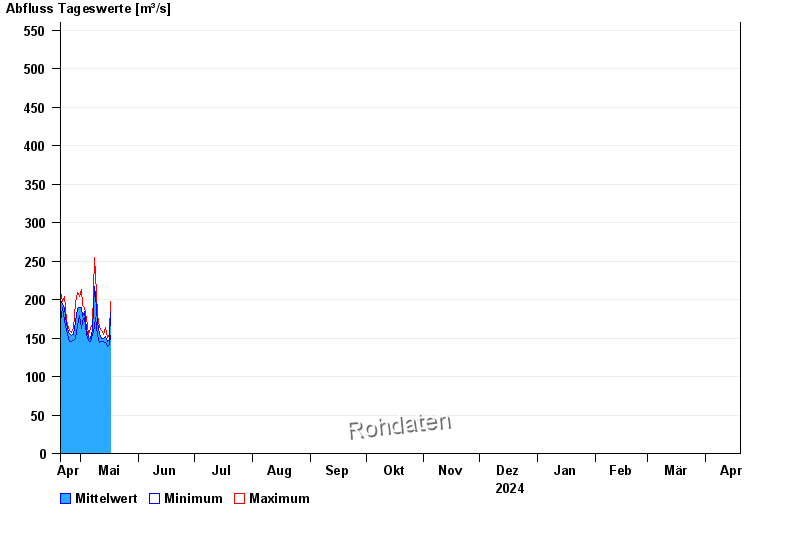
- Neu Ulm, Bad Held >
- Chart of year

Chart of year Neu Ulm, Bad Held / Donau
Discharge from 20.04.2024 to 19.04.2025
ACHTUNG!
Pegel durch außerordentlichen Kraftwerksbetrieb beeinflusst.
- HQ1 560 m³/s
- HQ2 660 m³/s
- HQ5 760 m³/s
- HQ10 880 m³/s
- HQ20 980 m³/s
- HQ50 1110 m³/s
- HQ100 1250 m³/s
| Date | Mean value [m³/s] | Maximum [m³/s] | Minimum [m³/s] |
|---|---|---|---|
| 09.06.2024 | 406 | 464 | 377 |
| 08.06.2024 | 394 | 414 | 375 |
| 07.06.2024 | 429 | 452 | 397 |
| 06.06.2024 | 488 | 522 | 455 |
| 05.06.2024 | 593 | 674 | 517 |
| 04.06.2024 | 785 | 928 | 642 |
| 03.06.2024 | 778 | 895 | 696 |
© Bayerisches Landesamt für Umwelt 2024