
- Start >
- Rivers >
- Discharge >
- Iller - Lech - Bodensee >
- Lechbruck >
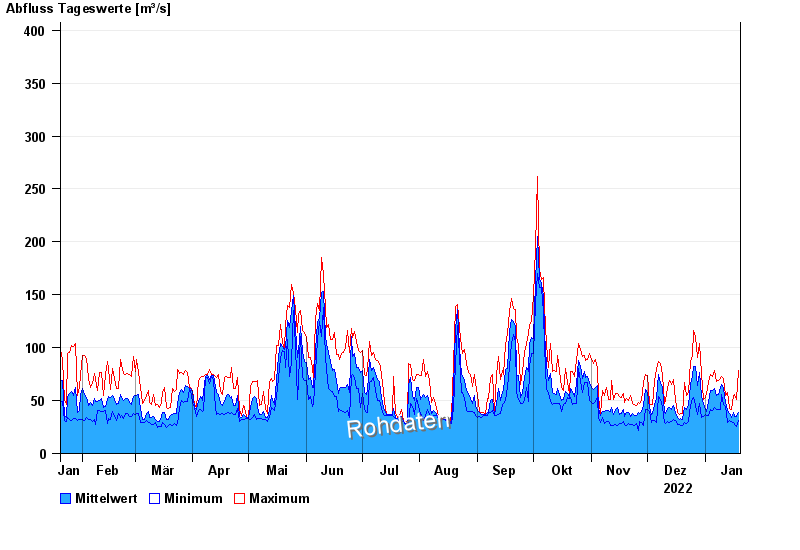
- Chart of year

Chart of year Lechbruck / Lech
Discharge from 20.01.2022 to 19.01.2023
note
Messwerte beeinflusst durch Kraftwerkssteuerungen.
- 10.08.1970 Abfluss: 971 m³/s
- 22.05.1999 Abfluss: 855 m³/s
- 23.08.2005 Abfluss: 836 m³/s
- 13.05.1999 Abfluss: 700 m³/s
- 23.07.1966 Abfluss: 640 m³/s
| Date | Mean value [m³/s] | Maximum [m³/s] | Minimum [m³/s] |
|---|---|---|---|
| 19.01.2023 | 39.2 | 78.2 | 31.4 |
| 18.01.2023 | 34.6 | 51 | 25.5 |
| 17.01.2023 | 34.7 | 55.5 | 27 |
| 16.01.2023 | 38.3 | 54.5 | 29.6 |
| 15.01.2023 | 34.4 | 41.2 | 30.2 |
| 14.01.2023 | 38 | 42.7 | 30.8 |
| 13.01.2023 | 40.8 | 57.4 | 29.6 |
© Bayerisches Landesamt für Umwelt 2024