
- Start >
- Rivers >
- Discharge >
- Iller - Lech - Bodensee >
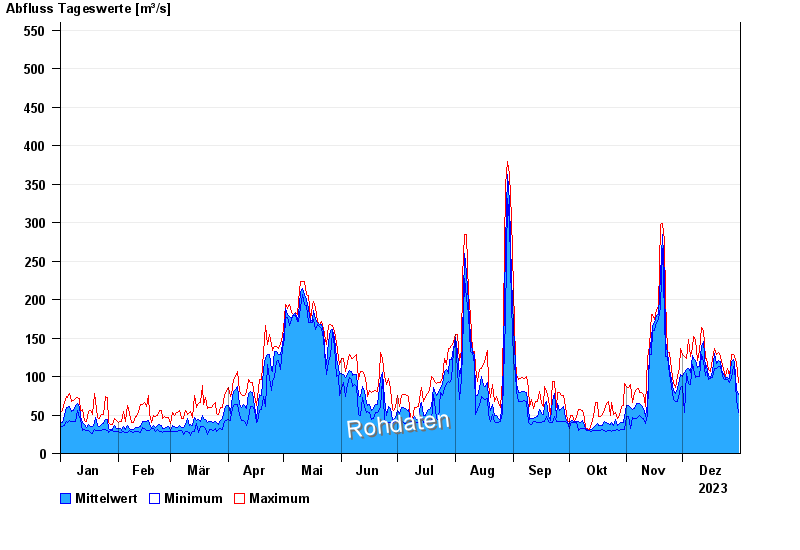
- Lechbruck >
- Chart of year

Chart of year Lechbruck / Lech
Discharge from 01.01.2023 to 31.12.2023
note
Messwerte beeinflusst durch Kraftwerkssteuerungen.
- 10.08.1970 Abfluss: 971 m³/s
- 22.05.1999 Abfluss: 855 m³/s
- 23.08.2005 Abfluss: 836 m³/s
- 13.05.1999 Abfluss: 700 m³/s
- 23.07.1966 Abfluss: 640 m³/s
| Date | Mean value [m³/s] | Maximum [m³/s] | Minimum [m³/s] |
|---|---|---|---|
| 31.12.2023 | 77 | 92.9 | 53 |
| 30.12.2023 | 81.9 | 118 | 69.3 |
| 29.12.2023 | 118 | 126 | 113 |
| 28.12.2023 | 122 | 129 | 113 |
| 27.12.2023 | 120 | 128 | 98.4 |
| 26.12.2023 | 97.8 | 100 | 92.9 |
| 25.12.2023 | 99.2 | 110 | 95.6 |
© Bayerisches Landesamt für Umwelt 2024